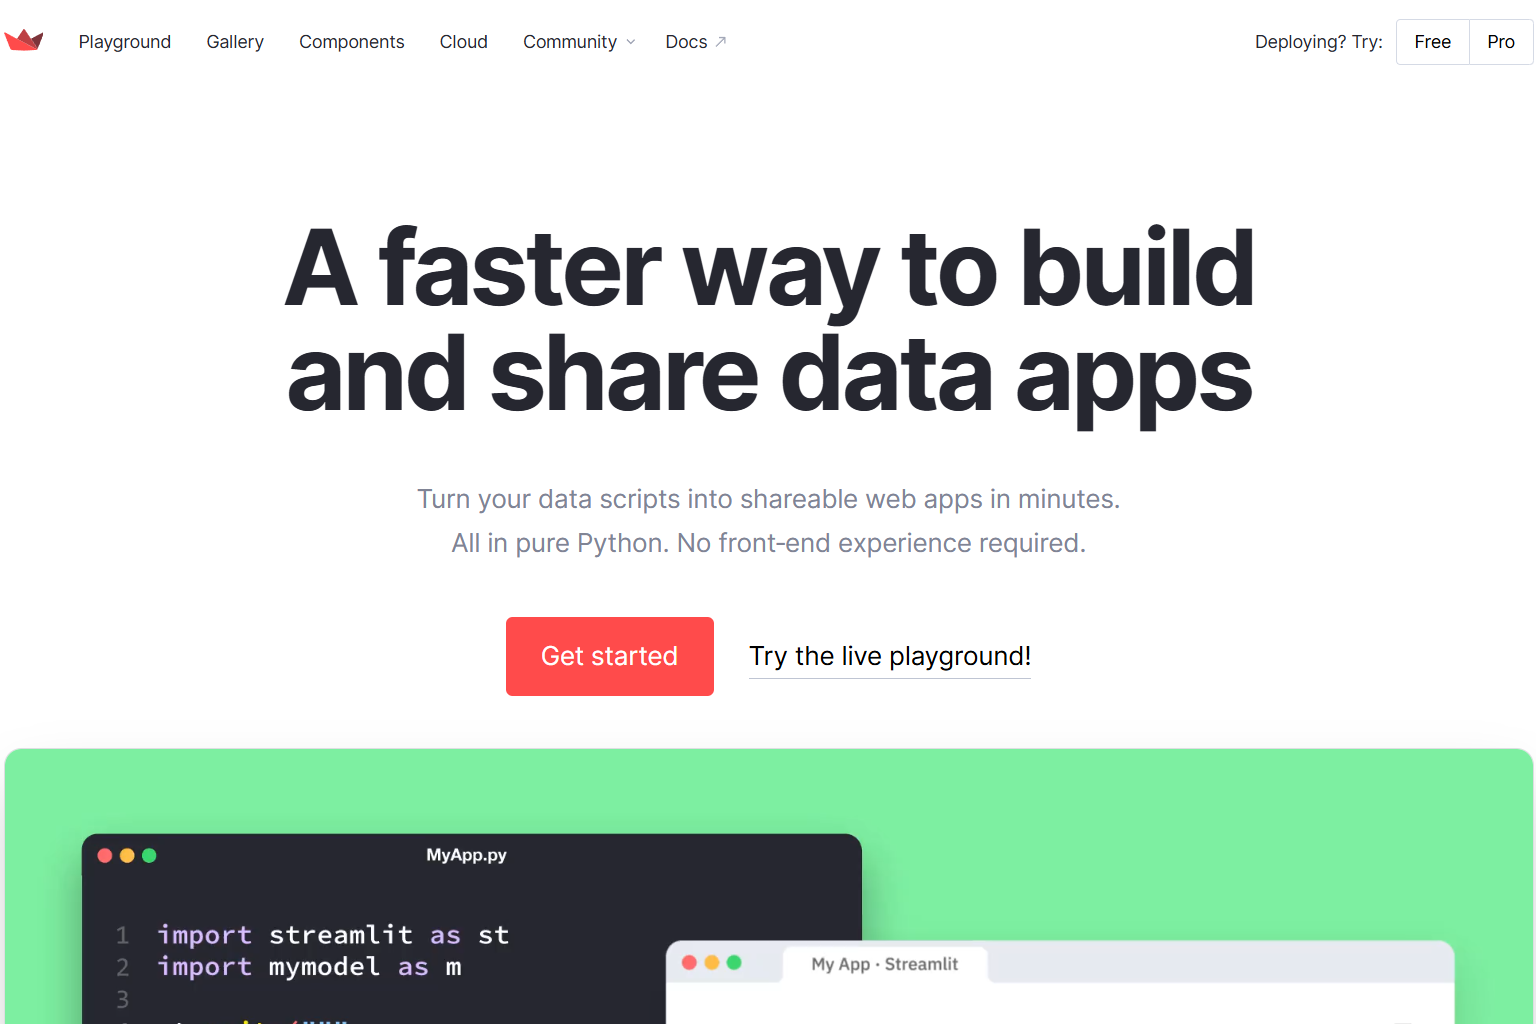
This time around, I tried out Streamlit — a framework that lets you build web apps easily with Python — and I’d like to share my experience, covering how to use it and what makes it so appealing.
What Is Streamlit?
Streamlit is an open-source framework written in Python that allows data scientists and machine learning engineers to create web apps with ease.
Normally, building a web application requires knowledge of front-end technologies like HTML, CSS, and JavaScript, but with Streamlit, you can build interactive web apps using nothing but Python code. That’s what makes it so convenient.
Key Features of Streamlit
- Python-only: No front-end knowledge required
- Real-time updates: Changes are reflected instantly when you modify the code
- Rich widgets: Buttons, sliders, charts, and many other components are available out of the box
- Simple syntax: Intuitive and easy-to-understand API design
I think it’s an incredibly useful framework for visualizing data analysis results or building demo apps for machine learning models.
How to Install Streamlit
Installing Streamlit is incredibly straightforward. You can install it with a single pip command.
pip install streamlitIf you’re using a virtual environment, make sure to activate it before installing.
# Creating a virtual environment
python -m venv venv

# Windows
venv\Scripts\activate

# Mac/Linux
source venv/bin/activate

# Install Streamlit
pip install streamlit
Once the installation is complete, verify it by checking the version.
streamlit --versionIf the Streamlit version is displayed, the installation was successful.
Basic Usage
Now let’s actually build a simple web app with Streamlit.
Hello World App
Let’s start with a basic “Hello World” app. Create a file called app.py and write the following code.
import streamlit as st

st.title('Hello Streamlit!')
st.write('Welcome to the world of Streamlit!')
To launch this app, run the following command in your terminal.
streamlit run app.pyYour browser should automatically open and display the app. By default, you can access it at http://localhost:8501.
Key Components
Streamlit comes with a wide variety of components. Here are some of the most commonly used ones.
Text Display
import streamlit as st

# Title
st.title('Title')

# Header
st.header('Header')

# Subheader
st.subheader('Subheader')

# Regular text
st.write('This is regular text')

# Markdown
st.markdown('**Bold** and *italic* are supported')
Input Widgets
# Text input
name = st.text_input('Please enter your name')
st.write(f'Hello, {name}!')

# Slider
age = st.slider('Select your age', 0, 100, 25)
st.write(f'You are {age} years old')

# Button
if st.button('Click me'):
    st.write('Button was clicked!')

# Select box
option = st.selectbox(
    'What is your favorite language?',
    ['Python', 'JavaScript', 'Go', 'Rust']
)
st.write(f'You selected {option}')
Data Display and Charts
Streamlit also excels at data visualization.
import pandas as pd
import numpy as np

# DataFrame display
df = pd.DataFrame({
    'Column 1': [1, 2, 3, 4],
    'Column 2': [10, 20, 30, 40]
})
st.dataframe(df)

# Line chart
chart_data = pd.DataFrame(
    np.random.randn(20, 3),
    columns=['a', 'b', 'c']
)
st.line_chart(chart_data)

# Area chart
st.area_chart(chart_data)

# Bar chart
st.bar_chart(chart_data)
By combining just these basic components, you can build surprisingly full-featured applications.
Practical Examples
Now let’s look at some more practical use cases.
Example 1: Data Analysis Dashboard
Here’s a dashboard that lets you upload and analyze CSV files.
import streamlit as st
import pandas as pd
import matplotlib.pyplot as plt

st.title('Data Analysis Dashboard')

# File upload
uploaded_file = st.file_uploader("Select a CSV file", type='csv')

if uploaded_file is not None:
    # Load data
    df = pd.read_csv(uploaded_file)

    # Data preview
    st.subheader('Data Preview')
    st.dataframe(df.head())

    # Basic statistics
    st.subheader('Basic Statistics')
    st.write(df.describe())

    # Column selection
    columns = df.columns.tolist()
    selected_column = st.selectbox('Select a column to visualize', columns)

    # Histogram
    st.subheader(f'Histogram of {selected_column}')
    fig, ax = plt.subplots()
    ax.hist(df[selected_column].dropna(), bins=30)
    st.pyplot(fig)
With this code, you can quickly put together a data analysis dashboard. It’s definitely production-ready for real projects.
Example 2: Image Processing App
I also built an app that lets you upload images and apply filters.
import streamlit as st
from PIL import Image, ImageFilter

st.title('Image Processing App')

# Image upload
uploaded_image = st.file_uploader("Select an image", type=['jpg', 'jpeg', 'png'])

if uploaded_image is not None:
    # Load image
    image = Image.open(uploaded_image)

    # Display original
    st.subheader('Original Image')
    st.image(image, use_column_width=True)

    # Filter selection
    filter_type = st.selectbox(
        'Select a filter',
        ['None', 'Blur', 'Edge Detection', 'Sharpen']
    )

    # Apply filter
    if filter_type == 'Blur':
        filtered_image = image.filter(ImageFilter.BLUR)
    elif filter_type == 'Edge Detection':
        filtered_image = image.filter(ImageFilter.FIND_EDGES)
    elif filter_type == 'Sharpen':
        filtered_image = image.filter(ImageFilter.SHARPEN)
    else:
        filtered_image = image

    # Display processed image
    st.subheader('Processed Image')
    st.image(filtered_image, use_column_width=True)
It’s pretty impressive that you can build an image processing app like this in just a few dozen lines of code.
Example 3: Machine Learning Model Demo
Building demo apps for machine learning models is actually one of Streamlit’s specialties.
import streamlit as st
import numpy as np
from sklearn.datasets import load_iris
from sklearn.ensemble import RandomForestClassifier

st.title('Iris Classifier')

# Train the model
@st.cache_resource
def train_model():
    iris = load_iris()
    clf = RandomForestClassifier()
    clf.fit(iris.data, iris.target)
    return clf, iris

clf, iris = train_model()

# Input fields
st.subheader('Enter flower measurements')
col1, col2 = st.columns(2)

with col1:
    sepal_length = st.slider('Sepal Length', 4.0, 8.0, 5.0)
    sepal_width = st.slider('Sepal Width', 2.0, 4.5, 3.0)

with col2:
    petal_length = st.slider('Petal Length', 1.0, 7.0, 4.0)
    petal_width = st.slider('Petal Width', 0.1, 2.5, 1.0)

# Prediction
if st.button('Classify'):
    features = np.array([[sepal_length, sepal_width, petal_length, petal_width]])
    prediction = clf.predict(features)[0]
    species = iris.target_names[prediction]

    st.success(f'Prediction: **{species}**')

    # Show probabilities
    probabilities = clf.predict_proba(features)[0]
    st.subheader('Probability for each class')
    for i, prob in enumerate(probabilities):
        st.write(f'{iris.target_names[i]}: {prob:.2%}')
The @st.cache_resource decorator is also a handy feature that lets you cache model training results.
Useful Streamlit Features
Streamlit offers plenty of other useful features as well.
| Feature | Description | Usage |
| Sidebar | Place content in a left sidebar | st.sidebar.slider() |
| Column Layout | Split the screen into multiple columns | st.columns(2) |
| Expander | Collapsible sections | st.expander() |
| Progress Bar | Show processing progress | st.progress() |
| Cache | Cache function results | @st.cache_data |
Combining these features lets you build even more sophisticated applications.
Conclusion
In this article, I covered web app development using Streamlit.
To summarize what makes Streamlit so appealing:
- Low learning curve: You only need Python knowledge to get started
- Fast development: Rapid prototyping made easy
- Clean code: Feature-rich apps with minimal code
- Easy deployment: Publish for free using Streamlit Cloud
After using it hands-on, I found it to be the ideal tool for sharing data analysis results and building machine learning model demos. It may not be suited for large-scale applications, but for internal tools and prototyping, it offers more than enough functionality.
By the way, apps built with Streamlit can be easily published using Streamlit Cloud, a free hosting service that integrates with GitHub. Definitely worth trying out.
If you’re working with data analysis or machine learning in Python, I highly recommend giving Streamlit a try. It will most likely boost your development productivity.
I hope this article serves as a helpful reference for your Streamlit journey.

![[1809 Compatible] How to Completely Remove Bloatware from Windows 10 (Essentially Making It LTSB)](https://miyagadget.page/wp-content/uploads/2023/08/WINDOWS10.jpg)


Leave a Reply