Hello, this is Shichinomiya (@shichinomiya_s).
On August 14, 2026, Qwen3.8-27B was released under Apache 2.0. It is a 27B dense model with a built-in vision encoder and a native context of 262,144 tokens (extensible to one million) — arguably the strongest model you can currently run on a single GPU.
I ran it on an NVIDIA Tesla V100 32GB. Volta, 2017, compute capability sm_70. No hardware bfloat16, no FP8, and FlashAttention 2 does not work. This is the architecture that the 2026 inference stacks have been dropping one after another.
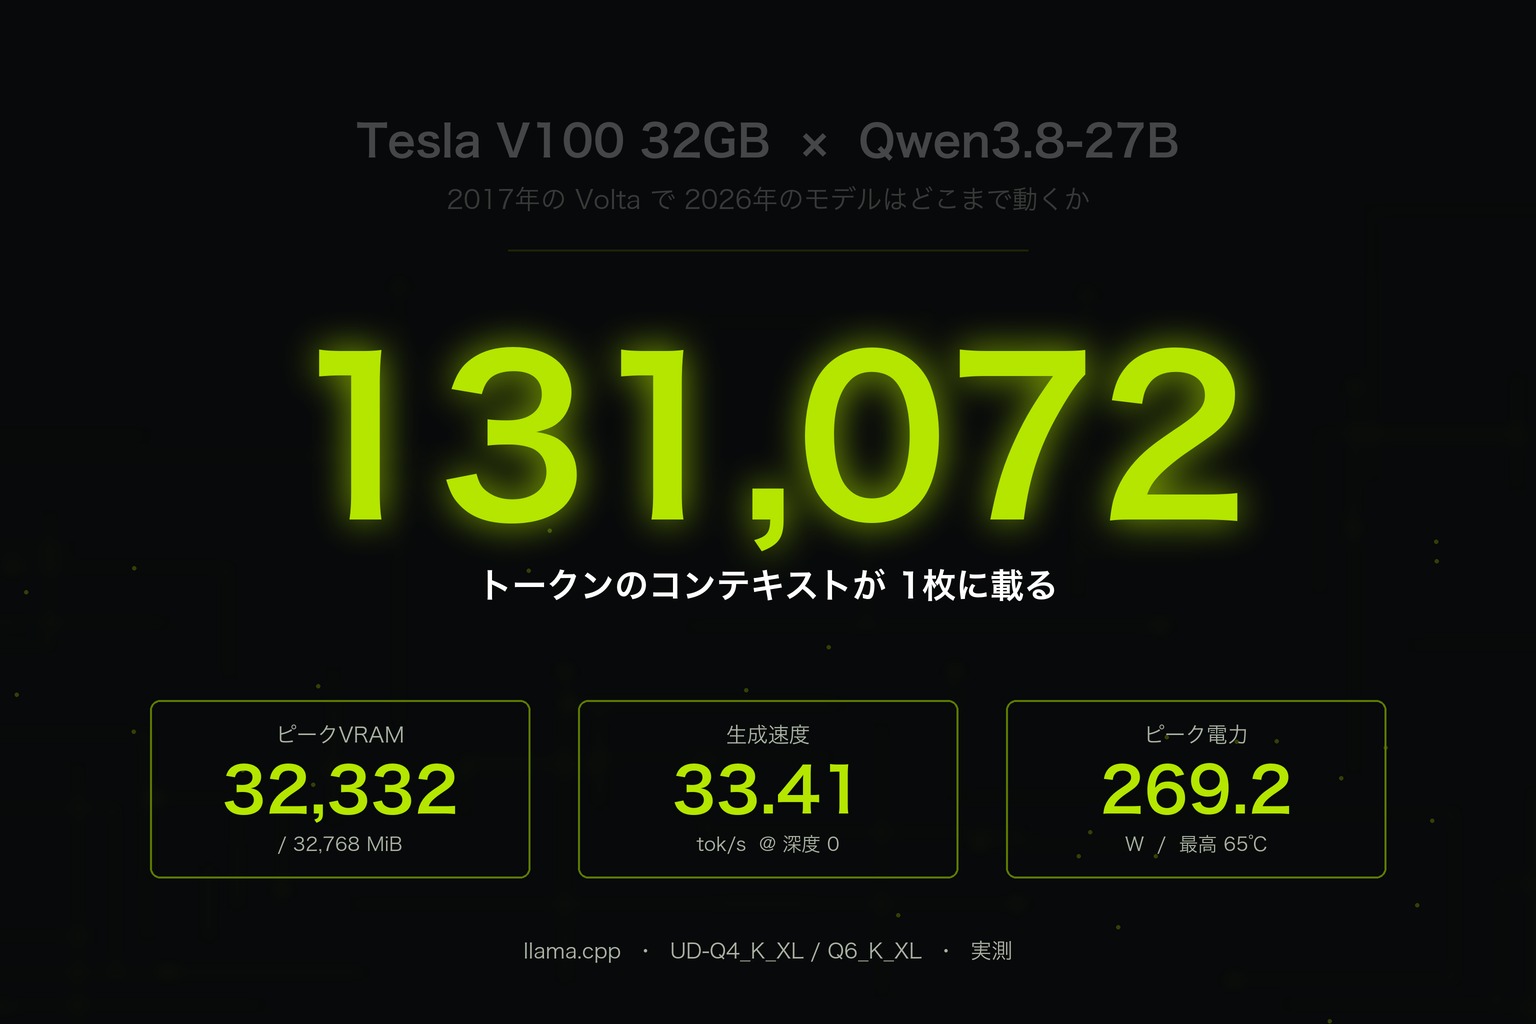
The short version: it works, and a 131,072-token context fits on a single card. But while benchmarking for this article, two things became very clear — settings you must not use on a V100, and one setting you have to know about or the model is not practical. I’m putting all of it here.
Every number below comes from my own measurement logs. The parts that did not go well are here too.
The results up front
| Metric | Measured |
|---|---|
| Generation (depth 0) | 33.41 tok/s (UD-Q4_K_XL) |
| Generation (depth 131,072) | 15.84 tok/s |
| Prefill (depth 0) | 826.03 tok/s |
| Peak VRAM (Q4, depth 131,072) | 25,264 MiB / 32,768 MiB |
| Peak VRAM (Q6, depth 131,072) | 32,332 MiB / 32,768 MiB (436 MiB left) |
| Load time | 6.85 / 6.87 / 6.89 s |
| Peak power / temperature | 269.2 W / 65 °C |
| Vision (image understanding) | Works |
| KV cache quantization | Unusable (falls back to CPU) |
The one line that matters most: add
--reasoning-budget 1024. Without it, the model spends 134 seconds on a problem and never produces an answer. With it, it answers correctly in 39 seconds.
Test environment
| Item | Details |
|---|---|
| GPU | Tesla V100-PCIE-32GB (compute capability 7.0 / sm_70) |
| Memory bandwidth (reported) | 779.8 GB/s |
| Driver | 580.173.02 |
| CUDA | 12.4 (devel image) |
| CPU / RAM | Xeon E5-2650 v4 (6/24 vCPU) / 32 GB |
| Storage | SATA SSD (~894 MB/s read) |
| Inference engine | llama.cpp d230ddd / f9f09f0 (2026-09-03), built from source with -DCMAKE_CUDA_ARCHITECTURES=70 |
| Model | Qwen3.8-27B (27.32B; llama.cpp reports the arch as qwen35) |
| Quantization | Unsloth GGUF UD-Q4_K_XL / UD-Q5_K_XL / UD-Q6_K_XL; vision uses mmproj-F16 |
| Method | llama-bench with -r 3 (-r 1 at depth 131,072). VRAM, power and temperature are peaks from a 1-second nvidia-smi log |
Note that you want the F16 mmproj, not the BF16 one — Volta has no hardware bfloat16. That theme repeats throughout this article: the V100 story starts at “there is no bf16” and keeps coming back to it.
V100 32G Graphics Card PCIe Customized AI Artifact CUDA Graphics Card
The first thing that stopped me: CUDA 13 dropped Volta
Before the benchmarks. This is where I first got stuck.
In 2026, the default filters on a GPU selection screen are usually compute_cap>=800 (Ampere or newer) and cuda_max_good>=13. With those defaults, the V100 does not appear at all. CUDA 13 dropping Volta support shows up, very concretely, as the card vanishing from the list of options.
Lowering it to compute_cap=700 and switching the container image to a CUDA 12 devel build finally surfaced candidates. If you want to use a V100, CUDA 12.x plus an explicit sm_70 build is effectively mandatory. Building llama.cpp took about 16 minutes on 24 threads.
cmake -S llama.cpp -B llama.cpp/build \
  -DCMAKE_BUILD_TYPE=Release -DGGML_CUDA=ON \
  -DCMAKE_CUDA_ARCHITECTURES=70 -DLLAMA_CURL=ON
cmake --build llama.cpp/build -j$(nproc) \
  --target llama-bench llama-cli llama-mtmd-cli
Result 1: does it even run? Hybrid attention on sm_70
Qwen3.8-27B uses a hybrid attention stack: of its 64 layers, 48 are GatedDeltaNet linear-attention layers and only 16 are conventional full attention. The linear-attention layers keep no conventional KV cache.
This was my biggest worry. Those CUDA kernels are relatively new, and nothing guarantees they run on 2017-era Volta. If they had not, this would have been an article about a model that would not load.
It worked on the first try.
> 日本語で「動作確認OK」とだけ出力してください。

[Start thinking]
The user is asking me to output only "動作確認OK" in Japanese.
This is a simple request - just output that exact text.
[End thinking]

動作確認OK

[ Prompt: 119.4 t/s | Generation: 31.8 t/s ]
Peak VRAM here was 16,626 MiB, peak power 205.7 W, peak temperature 41 °C. That is barely half of the 32 GB. If a 27B model fits with that much headroom, the rest can go to context.
Result 2: context length — 131,072 tokens fit on one card
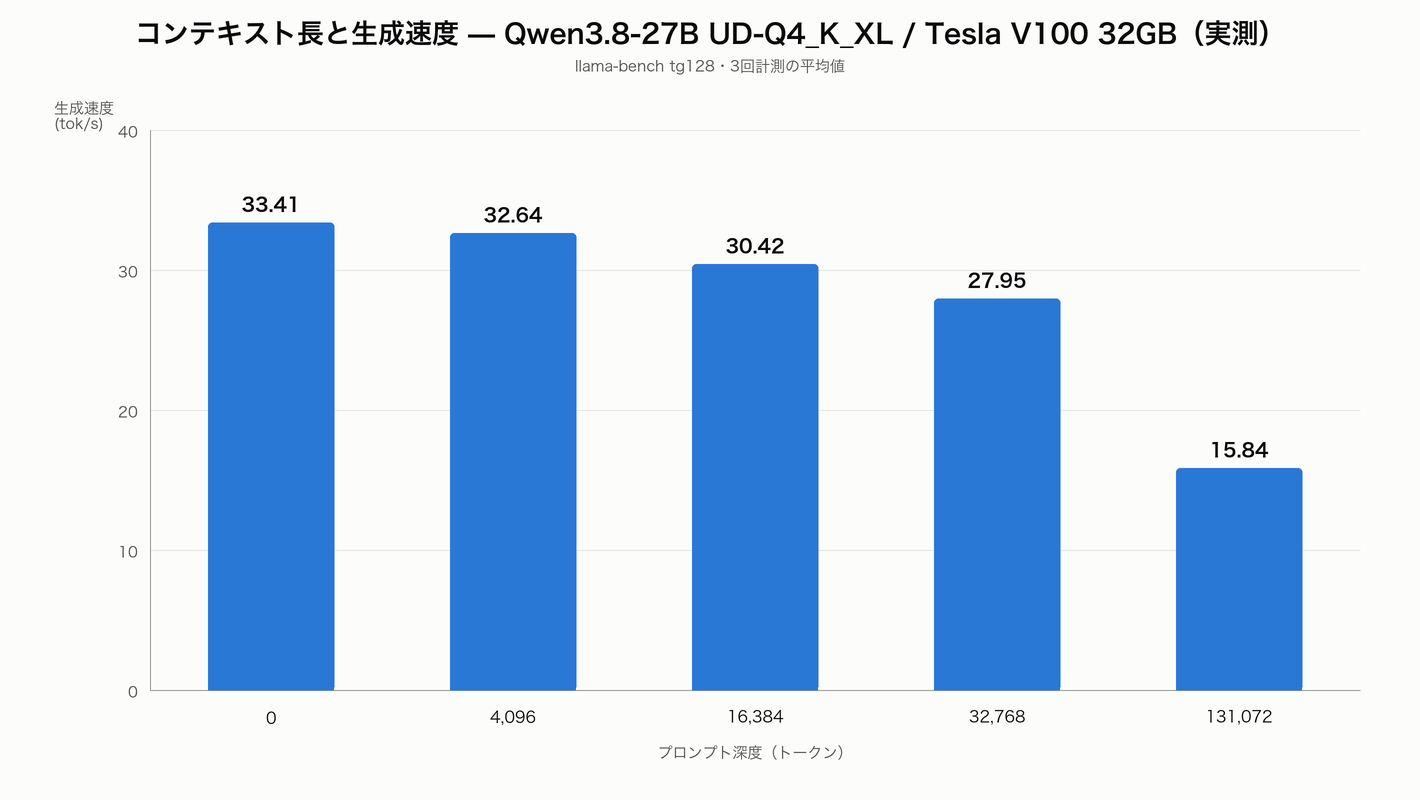
| Prompt depth | Prefill (tok/s) | Generation (tok/s) | Peak VRAM |
|---|---|---|---|
| 0 | 826.03 ± 30.12 | 33.41 ± 0.06 | 16,986 MiB |
| 4,096 | 766.02 ± 20.94 | 32.64 ± 0.12 | — |
| 16,384 | 634.59 ± 16.80 | 30.42 ± 0.07 | 18,004 MiB |
| 32,768 | 511.91 ± 11.66 | 27.95 ± 0.08 | 19,028 MiB |
| 131,072 | 236.50 | 15.84 | 25,264 MiB |
With 32,768 tokens in the prompt, generation still runs at 27.95 tok/s — only 16% below depth 0 — and VRAM stays just under 19 GB.
Then 131,072 tokens. It went through at 25,264 MiB, leaving more than 7 GB free. Because 48 of the 64 layers hold no KV cache, extending the context barely moves VRAM at all. Generation drops to 15.84 tok/s, but for feeding a 100k-token document in and asking questions about it, that is comfortably usable.
In a needle-in-a-haystack test — one fact buried in a roughly 20,000-token Japanese document — the model extracted both the serial number and the date correctly. Prefill was 708.5 tok/s and generation 29.2 tok/s.
Q: Give the serial number of the backup power unit in Warehouse 7,
   and its next inspection date.

- Serial number: V100-KX-4827
- Next inspection: 2027-03-14
Result 3: quantization — Q6_K fits, but 128k leaves 436 MiB
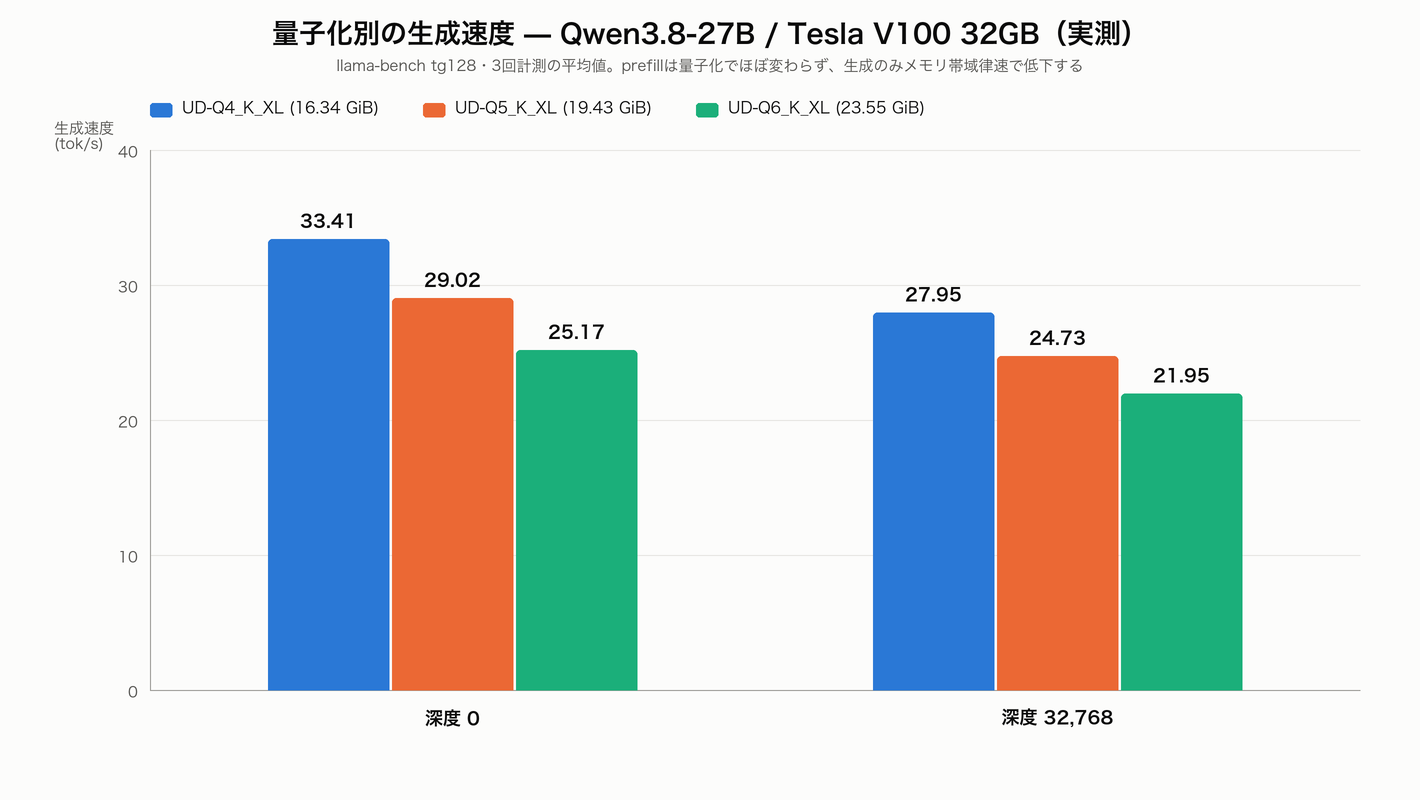
| Quantization | Size | Prefill | Generation | Prefill@32k | Generation@32k |
|---|---|---|---|---|---|
| UD-Q4_K_XL | 16.34 GiB | 826.03 | 33.41 | 511.91 | 27.95 |
| UD-Q5_K_XL | 19.43 GiB | 847.88 | 29.02 | 515.15 | 24.73 |
| UD-Q6_K_XL | 23.55 GiB | 881.51 | 25.17 | 529.75 | 21.95 |
The interesting part is that prefill does not degrade as quantization goes up — it actually creeps upward. Prefill is compute-bound, so a heavier model does not slow it down. Generation is memory-bandwidth-bound, and it falls a clean 25% from Q4 to Q6. That is the V100’s HBM2 bandwidth showing through directly.
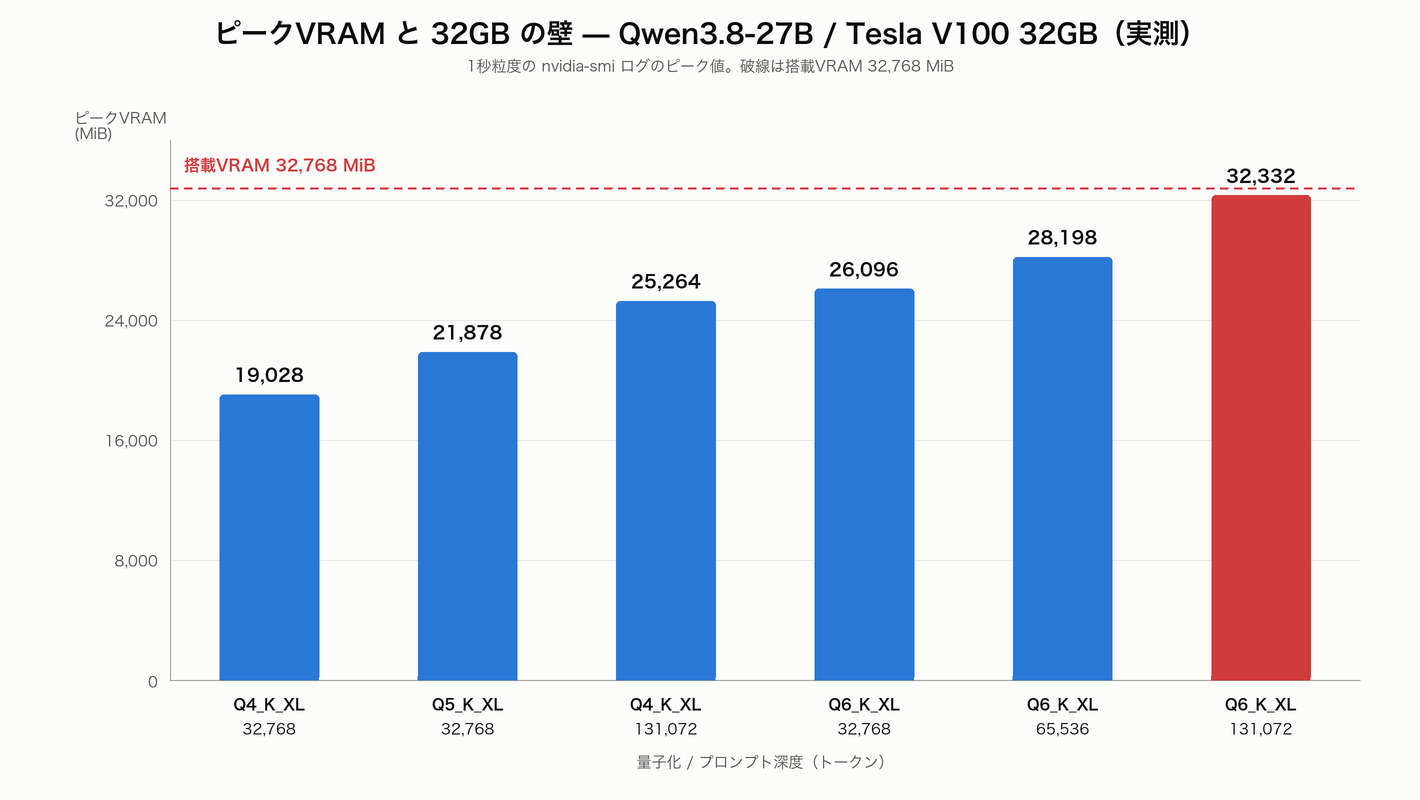
And the VRAM picture. Q6_K_XL also cleared 131,072 tokens — but at a peak of 32,332 MiB out of 32,768 MiB. That is 436 MiB of headroom.
It is fair to say it fits, but this is not a configuration to aim for in production. The V100 has no display output so nothing else is drawing on it, yet any other process touching VRAM will push you over. For daily use, Q4_K_XL at 128k (25.3 GB) or Q6_K_XL at 64k (28.2 GB) are the realistic choices.
Result 4: the sm_70 wall — do not quantize the KV cache
This was the most “V100” result of the whole run.
Running with -ctk q8_0 -ctv q8_0 produced this:
| Metric | f16 (normal) | q8_0 |
|---|---|---|
| GPU utilization | 97–100% | 0% |
| Power draw | ~250 W | 36 W |
| CPU usage | — | 553% |
| Outcome | 506.43 / 27.94 tok/s | Not one case finished in 10 minutes |
There is no q8_0 KV CUDA kernel for sm_70, so it silently fell back to the CPU. The GPU sits idle while nothing finishes — the nastiest kind of failure. I killed it after ten minutes.
The saving grace is that the linear attention keeps the KV cache small in the first place. Deciding to never use KV quantization on a V100 costs you almost nothing.
While I was there, I also checked the -fa (FlashAttention) flag.
| -fa | Prefill | Generation |
|---|---|---|
| 0 | 818.70 ± 27.78 | 33.30 ± 0.08 |
| 1 | 821.02 ± 23.67 | 33.44 ± 0.06 |
The difference is inside the noise. Volta does not support FA2, so that is expected — but the flag passes through silently instead of erroring, which makes it easy to believe it is doing something. On or off, it is the same.
Result 5: the real usability problem — thinking never ends
This is the part to read if you plan to run Qwen3.8 on a V100.
Qwen3.8 has thinking enabled by default, and llama.cpp exposes --reasoning-effort as a first-class flag. Except:
none is not accepted. The chat template throws.
Error: Jinja Exception: Unexpected reasoning effort none.
Supported types are xhigh (default), medium, and low.
And with the three remaining levels, on a logic puzzle whose answer is 6 hours 42 minutes 13 seconds (which I verified by hand):
| reasoning_effort | Wall time | Thinking closed | Answer |
|---|---|---|---|
| low | 134 s | No | None given |
| medium | 135 s | No | None given |
| xhigh | 134 s | No | None given |
All three burned the full 4,096-token budget thinking and never reached an answer. Note that low was not faster either — lowering the effort level did not shorten anything.
The same thing happened on a Japanese summarization task. Asked to “summarize in about 300 characters,” the model spent its entire thinking budget counting characters and never emitted the summary. This is how the output ends:
Total: 15+9+21+28+25+28+27+25+38+14+28 = 258

Hmm, that's about 258. I need to get closer to 300. Let me expand a bit.

Actually, I realize I'm overcomp
Generation itself runs at 32 tok/s. The speed is fine — the wasted thinking tokens are what you actually wait for. That is the real bottleneck when you run a 27B model on hardware that does 33 tok/s.
The fix: --reasoning-budget 1024
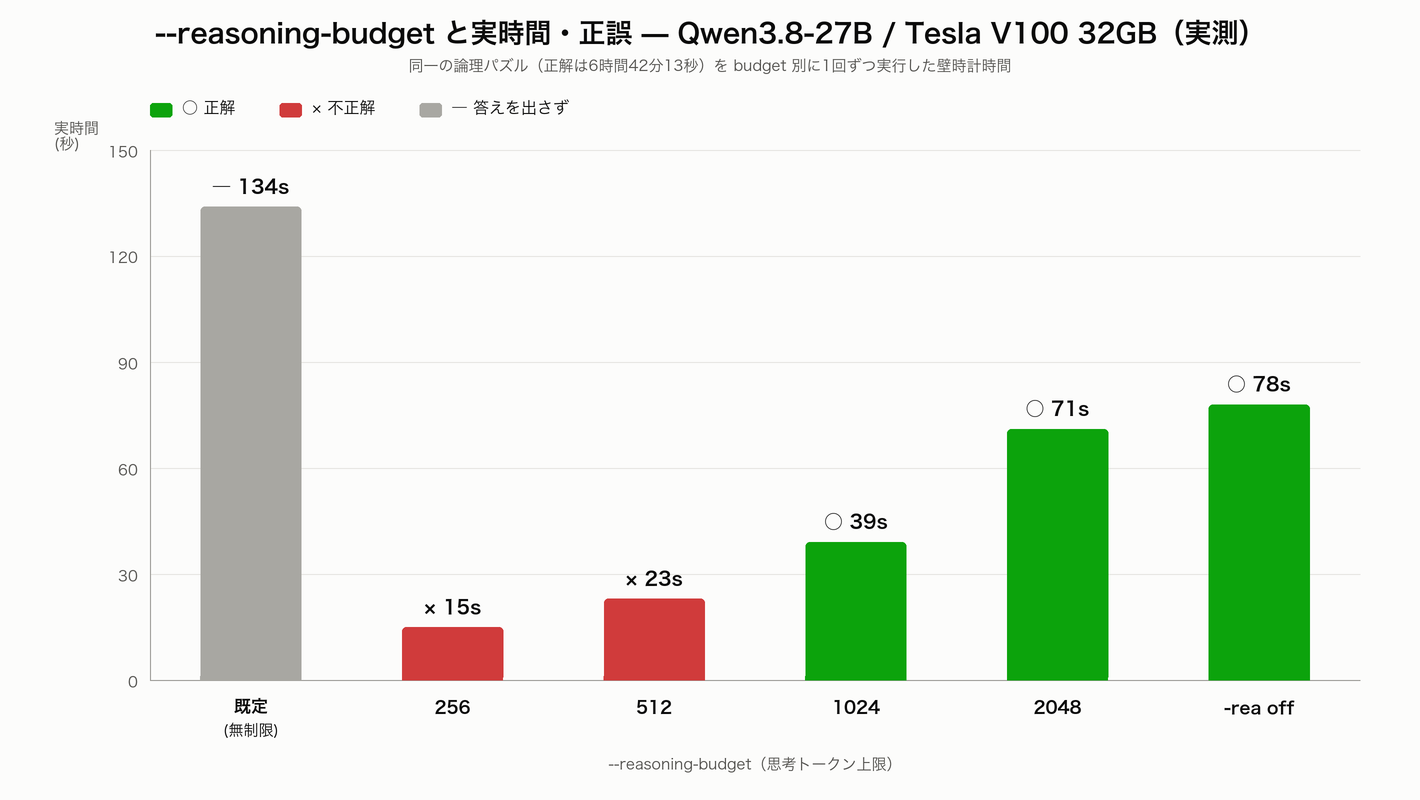
So I capped the thinking tokens with --reasoning-budget and reran the same problem.
| Setting | Wall time | Answer | Correct? |
|---|---|---|---|
| Default (unlimited) | 134 s | None given | — |
--reasoning-budget 0 | 134 s | Given | Thinking never closed |
--reasoning-budget 256 | 15 s | 7 h 10 min | Wrong |
--reasoning-budget 512 | 23 s | 7 h 20 min | Wrong |
--reasoning-budget 1024 | 39 s | 6 h 42 min 13 s | Correct |
--reasoning-budget 2048 | 71 s | 6 h 42 min 13 s | Correct |
-rea off (no thinking) | 78 s | 6 h 42 and 2/9 min | Correct |
1024 is the sweet spot. It reaches the same correct answer in 39 seconds. Since the unlimited default spends 134 seconds and produces nothing, that is more than a 3.4x improvement — and it returns an answer the default never gave.
Tighten it to 256 or 512 and you get 15–23 seconds, but the answers are wrong. The speed/accuracy trade-off is real, and on this problem the boundary sat at 1024.
Also worth noting: --reasoning-budget 0 is documented as “end thinking immediately,” but in practice it behaved exactly like unlimited (134 s, thinking never closed). I would avoid 0.
And a surprise: turning thinking off entirely with -rea off took 78 seconds — slower than budget 1024 at 39 seconds. With thinking disabled the prose answer gets longer, so “thinking off” is not the same as “fast.”
Result 6: vision — mmproj works on sm_70
Qwen3.8-27B has a built-in vision encoder, and the Unsloth GGUF ships mmproj-F16.gguf (0.93 GB) alongside it.
Handing an 800×600 photo to llama-mtmd-cli worked. Part of the output, translated:
In the background you can see heavily blurred trees. This is the photographic technique known as bokeh, used here to make the grass in the foreground stand out. (…) It was shot from a low vantage point at ground level, which makes the viewer feel as though they are standing right above the grass. That perspective gives ordinary grass the presence of skyscrapers or a forest.
Foreground, background, bokeh, lighting and composition — it reads the image in real detail. Vision runs fine on sm_70.
One caveat: the tail of the output drifted into Chinese (“总而言之”, “宏大的”), and one word came out broken as a Japanese/English hybrid. This looks like language drift from the Q4_K_XL quantization. If you need reliable Japanese output, either move up a quantization level or add an output check.
Result 7: quality — strong when it finishes
| Task | Outcome | Prefill | Generation |
|---|---|---|---|
| Long-context reading (~20,000 tokens) | Correct | 708.5 | 29.2 |
| Python code generation | Correct, verified running | 321.3 | 32.5 |
| Logic puzzle (budget 1024) | Correct | 271.5 | 32.5 |
| Japanese summary (300-char target) | Failed (spent the budget counting characters) | 584.6 | 32.2 |
For code generation I asked for a function that parses llama-bench Markdown output into a list of dicts. I then ran the generated code against the actual benchmark output used in this article.
from __future__ import annotations
import re

def parse_llama_bench(md: str) -> list[dict[str, object]]:
    keys = ("model", "size", "params", "backend", "ngl", "test", "t_s")
    rows: list[dict[str, object]] = []
    for line in md.splitlines():
        line = line.strip()
        if not line.startswith("|") or re.fullmatch(r"\|[\s\-:|]+\|", line):
            continue
        cells = [c.strip() for c in line.strip("|").split("|")]
        if len(cells) < 7 or cells[0].lower() == "model":
            continue
        t_s = float(re.split(r"\s*±", cells[6])[0])
        rows.append(dict(zip(keys, (*cells[:6], t_s))))
    return rows
Skip the header and separator rows, drop the standard deviation after ±, return t_s as a float, return an empty list when there is no table — it satisfied every point of the spec and extracted all six rows correctly. It ran on the first try.
One footnote on the summarization failure. I gave the same task to Qwen3.6-27B (Q4_K_M) and it broke in exactly the same way (Total: 366. Still over. Let's trim more aggressively., counting to the end). So this is not a Qwen3.8-specific defect — it is a weakness of this model family when you specify a character count in Japanese. Ask for “short” or “three to four sentences” instead.
Power and temperature
| Stage | Peak power | Peak temperature |
|---|---|---|
| Just after load (4k) | 205.7 W | 41 °C |
| Depth sweep | 255.7 W | 63 °C |
| Depth 131,072 | 269.2 W | 62 °C |
| Quality tasks | 254.4 W | 65 °C |
269.2 W peak, 65 °C peak. The PCIe card’s TDP is 250 W so it briefly goes over, but the temperature topped out at 65 °C with no sign of thermal throttling. Load times of 6.85 / 6.87 / 6.89 s — 0.6% spread — were remarkably consistent.
Recommended settings for Qwen3.8-27B on a V100
# Build (sm_70 explicit; CUDA 12.x required)
cmake -S llama.cpp -B build -DCMAKE_BUILD_TYPE=Release \
  -DGGML_CUDA=ON -DCMAKE_CUDA_ARCHITECTURES=70 -DLLAMA_CURL=ON
cmake --build build -j$(nproc)

# Everyday use (Q4_K_XL, 32k, thinking capped at 1024)
./build/bin/llama-cli \
  -m Qwen3.8-27B-UD-Q4_K_XL.gguf -ngl 99 -c 32768 \
  --reasoning-budget 1024 \
  --temp 1.0 --top-p 0.95 --top-k 20

# Feeding in a long document (128k)
./build/bin/llama-cli \
  -m Qwen3.8-27B-UD-Q4_K_XL.gguf -ngl 99 -c 131072 \
  --reasoning-budget 1024

# Images (use the F16 mmproj)
./build/bin/llama-mtmd-cli \
  -m Qwen3.8-27B-UD-Q4_K_XL.gguf --mmproj mmproj-F16.gguf \
  -ngl 99 -c 16384 --image photo.jpg -p "Describe this image."
And what not to do:
-ctk q8_0 -ctv q8_0(KV quantization) — falls back to CPU and effectively hangs--reasoning-effort none— the chat template throws--reasoning-budget 0— behaves like unlimited- mmproj-BF16.gguf — Volta has no bf16; use the F16 build
- CUDA 13 images — Volta has been dropped
Who this is for, and what to watch out for
A good fit if
- You want to feed in 100k-token documents whole. 128k on a single card at 15.84 tok/s is genuinely usable for that
- You want 32 GB of VRAM cheaply. A 27B model runs here at over 800 tok/s prefill
- You are willing to build from source. Prebuilt binaries and current containers have dropped Volta
Watch out for
- No bf16, no FP8, no FA2, and the surrounding ecosystem keeps moving away. If you want vLLM or TensorRT-LLM, this is not your card
- Failures like KV quantization that “work” by quietly falling back to the CPU. Always watch GPU utilization
- No display output — you need a separate GPU for that
- Without knowing the thinking controls, you will wrongly conclude the model is slow
Conclusion
A 2017 Tesla V100 does run 2026’s Qwen3.8-27B.
- 33.41 tok/s on Q4_K_XL, and still 27.95 tok/s at 32k
- 131,072 tokens fit in 25,264 MiB. Q6_K fits too, but with only 436 MiB to spare
- Vision works, though Q4 shows Chinese-language drift
- Do not quantize the KV cache — it lands on the CPU
--reasoning-budget 1024decides whether this is practical: 39 s and correct, versus 134 s and no answer
“sm_70 is finished” is half true — the set of inference stacks available to you really has narrowed. But as long as the llama.cpp and GGUF path remains, 32 GB of HBM2 still has plenty of fight in it. The biggest takeaway for me was how well linear-attention models and the V100’s 32 GB pair up specifically for long context.
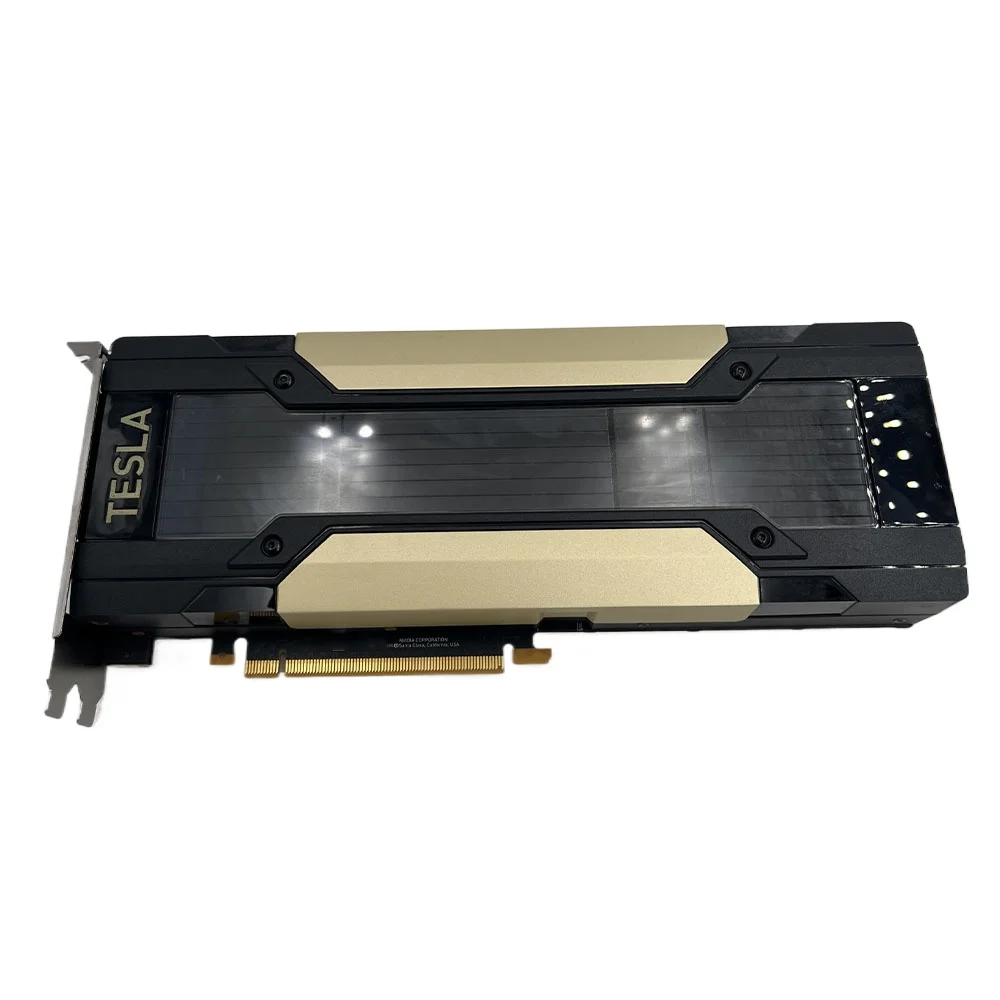
Used V100 PCIE 32GB Computing Graphics Card 32G SMX2 Interface Adapter Card PCIE Deep Learning GPU
Related
Reproduction notes
Every number above comes from the output of these commands.
# Fetch the model (name the files exactly; --include drops wildcards)
hf download unsloth/Qwen3.8-27B-GGUF \
  Qwen3.8-27B-UD-Q4_K_XL.gguf mmproj-F16.gguf --local-dir models

# Depth sweep
llama-bench -m models/Qwen3.8-27B-UD-Q4_K_XL.gguf -ngl 99 \
  -p 512 -n 128 -d 0,4096,32768 -r 3 -o md

# 128k (single run)
llama-bench -m models/Qwen3.8-27B-UD-Q4_K_XL.gguf -ngl 99 \
  -p 512 -n 128 -d 131072 -r 1 -o md

# Does the FlashAttention flag do anything?
llama-bench -m models/Qwen3.8-27B-UD-Q4_K_XL.gguf -ngl 99 \
  -p 512 -n 128 -fa 0,1 -r 3 -o md

# Log VRAM, power and temperature at 1s and take the peak
nvidia-smi --query-gpu=timestamp,memory.used,power.draw,temperature.gpu \
  --format=csv,noheader,nounits -l 1 > gpu.csv
All measurements were taken on the same machine with the same build. llama-bench used 3 runs (1 run at depth 131,072), and VRAM, power and temperature are peaks from a 1-second log. llama.cpp builds d230ddd and f9f09f0 (both 2026-09-03) were used.
See you next time.



Leave a Reply