Hello, this is Shichinomiya (@shichinomiya_s).
Following up on my previous benchmark running Qwen3.8-27B on a Tesla V100 32GB, I got my hands on another 32GB card with a completely different architecture: a modded RTX 4080 32GB from China. This hardware modification takes a standard 16GB RTX 4080 PCB and solders an additional 16GB of GDDR6X to reach 32GB total capacity—following the same lineage as the modded RTX 4090 48GB and RTX 2080 Ti 22GB cards that have recently appeared in volume across secondary markets.
The central question is straightforward: VRAM capacity has doubled, but memory bandwidth and GPU compute cores remain identical to the stock 16GB card. When memory bandwidth is unchanged, what does doubling capacity actually unlock, and what stays strictly the same? Testing the same models under the same conditions as the V100 article also demonstrates how two 32GB cards from different GPU generations compare.
I evaluated three distinct workloads:
- Qwen3.8-27B (dense 27B) — inference speed across quantizations, context scaling, and simulated 16GB / 24GB limits
- Qwen3.8-Flash-Next (125B-A6B MoE) — a massive model that cannot fit in 32GB, split between VRAM and system RAM
- MiniMax H3 — a DiT-based omni-modal video generation model with synchronized stereo audio
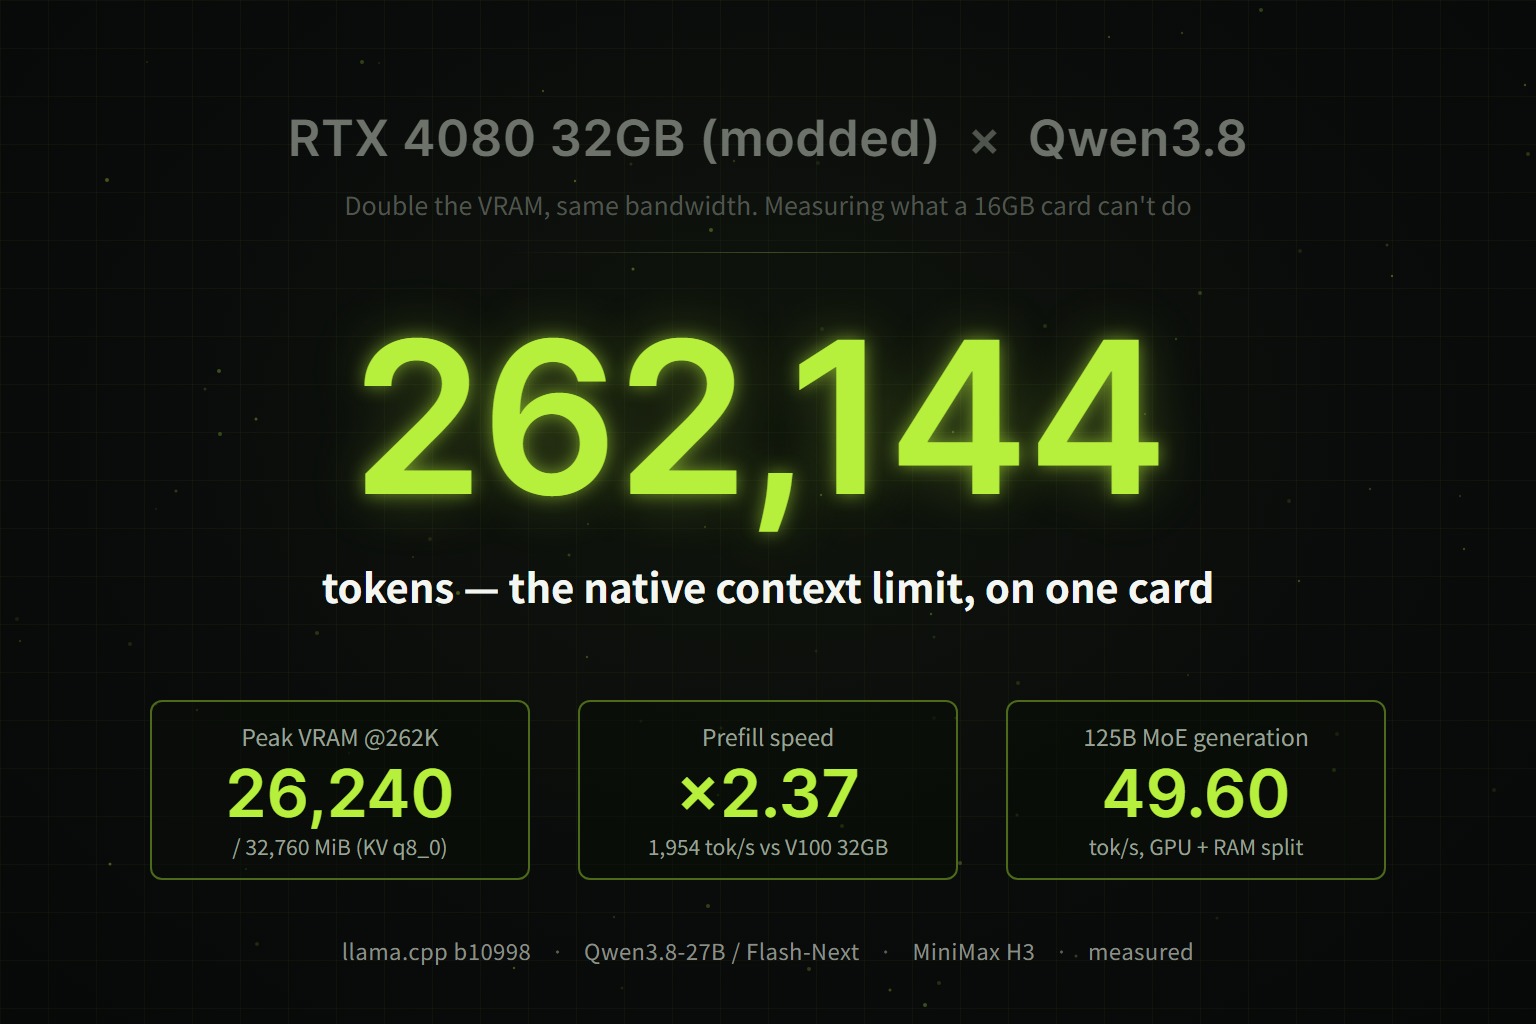
To state the conclusion upfront: token generation speed remains identical to the 16GB model, but the boundary of what fits on a single card expands substantially. Qwen3.8-27B (UD-Q4_K_XL) generates at 34.98 tok/s, virtually tied with the V100 (33.41 tok/s) despite the V100’s higher paper bandwidth. In exchange, Q8_0 (27.04 GiB) fits entirely within VRAM at 22.47 tok/s (versus 7.31 tok/s under a 24GB constraint), the native 262,144-token context runs in 26,240 MiB with q8_0 KV cache, and prefill is 2.4–3.2x faster than the V100. On the other hand, MiniMax H3 video generation ran at virtually the same speed even when restricted to a 16GB footprint, and minor VRAM overflows trigger silent, severe slowdowns rather than explicit errors.
All figures below are taken directly from empirical benchmark logs on physical hardware, including edge cases and configuration pitfalls encountered during testing.
Benchmark Summary
| Metric | Measured |
|---|---|
| Generation (Qwen3.8-27B UD-Q4_K_XL, depth 0) | 34.98 tok/s (Tesla V100 32GB: 33.41 tok/s) |
| Prefill (same) | 1,954.03 tok/s (2.37x vs. V100) |
| Q8_0, all layers on GPU | 22.47 tok/s / 29,012 MiB (24GB-class: 7.31, 16GB-class: 3.17 tok/s) |
| 262,144 tokens (KV q8_0) | 17.24 tok/s / 26,240 MiB |
| 100k-token document ingestion | 104,955 tokens processed in 84.8 s, correct answer retrieved |
| Qwen3.8-Flash-Next (125B MoE, UD-Q2_K_XL) | Split across system RAM, up to 49.60 tok/s |
| MiniMax H3 (1344×768, 5 s, turbo 4-step) | 150.1 s (150.2 s under 16GB limit) |
| Full VRAM test (memtest_vulkan) | 0 errors |
| 20 minutes continuous generation | Flat at 22.38–22.41 tok/s / memory junction max 82.0°C / no thermal throttling |
| Peak power | 321.08 W |
Operational Note: When using long context windows, passing
-ctk q8_0 -ctv q8_0is essential. With default f16 KV cache, a 262,144-token run did not complete even after 30 minutes due to memory overflow. With q8_0 KV cache, the entire benchmark finished in 6 minutes and 25 seconds at a steady 17.24 tok/s.
Hardware Architecture: Doubled Capacity, Unchanged Bandwidth
A factory RTX 4080 equips eight 2GB GDDR6X packages on the top side of the PCB across a 256-bit bus, totaling 16GB. This modded variant achieves 32GB via a clamshell implementation, soldering an additional eight memory chips onto the back of the board. Because the AD103 GPU silicon remains untouched, the 9,728 CUDA cores and the 256-bit bus width are identical to the factory specification. In theory, capacity is doubled while theoretical memory bandwidth (716.8 GB/s) remains strictly unchanged.
| Item | RTX 4080 (Stock) | Modded 32GB Unit |
|---|---|---|
| GPU | AD103 (Ada Lovelace / sm_89) | Same (Device ID 0x2704) |
| CUDA cores | 9,728 | Same |
| VRAM | 16GB GDDR6X | 32,760 MiB (reported by nvidia-smi) |
| Memory bus / speed | 256-bit / 22.4 Gbps (716.8 GB/s theoretical) | Same (max memory clock 11,201 MHz) |
| Power limit | 320W | 320W |
| PCIe | Gen4 x16 | Gen4 x16 (verified under load) |
| BAR1 (Resizable BAR aperture) | — | 16,384 MiB |
The reference Tesla V100 32GB utilizes HBM2 memory delivering approximately 900 GB/s—roughly 25% higher theoretical bandwidth than the RTX 4080. Since autoregressive LLM decoding is primarily memory-bandwidth-bound, one might reasonably expect the V100 to match or outperform the RTX 4080 in token generation. Testing this assumption was one of the primary motivations for this benchmark.
One quirk characteristic of modded cards appears in the bottom row of the table: the BAR1 aperture size remains at 16,384 MiB. While total VRAM is recognized as 32GB, the address window mapped directly by the CPU retains the factory 16GB VBIOS configuration. Its practical impact on model loading is analyzed later in this article.
> nvidia-smi --query-gpu=name,vbios_version,driver_version,memory.total,power.limit,pcie.link.gen.max,pcie.link.width.max --format=csv
name, vbios_version, driver_version, memory.total [MiB], power.limit [W], pcie.link.gen.max, pcie.link.width.max
NVIDIA GeForce RTX 4080, 95.03.33.40.5e, 616.56, 32760 MiB, 320.00 W, 4, 16

> nvidia-smi -q -d MEMORY
    FB Memory Usage
        Total                                          : 32760 MiB
        Reserved                                       : 392 MiB
    BAR1 Memory Usage
        Total                                          : 16384 MiB
        Used                                           : 16355 MiB
        Free                                           : 29 MiB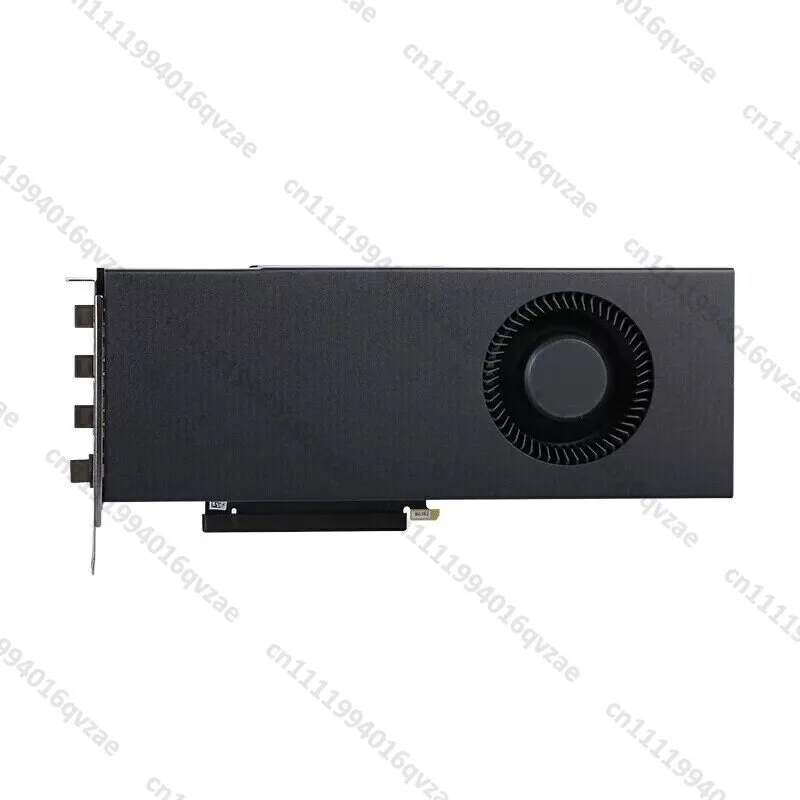
RTX4080 32G / RTX4080S 32G Turbo Graphics Card for GPU Rendering and AI
Test Environment
| Item | Details |
|---|---|
| GPU | NVIDIA GeForce RTX 4080 32GB (modded, single-fan blower) |
| Driver | 616.56 (CUDA 13.4) |
| CPU | AMD Ryzen 9 9950X (16 cores / 32 threads) |
| RAM | DDR5-4800 32GB x2 (64GB) |
| Motherboard | ASUS TUF GAMING X670E-PLUS WIFI |
| Storage | Samsung PM963 1.92TB (NVMe) |
| OS | Windows 11 Pro (build 26200) |
| LLM runtime | llama.cpp b10998 (37b53fd45), official Windows CUDA 13.4 build, unmodified |
| Video generation | ComfyUI 0.33.0 / PyTorch 2.13.0+cu130 |
| Methodology | llama-bench with -r 3 (-r 1 at depth 131,072 and above). VRAM, power, and temperature logged at 1-second intervals via nvidia-smi |
Display output was routed through the CPU’s integrated Radeon graphics, leaving the RTX 4080 entirely dedicated to compute. Consequently, the measured VRAM figures do not include desktop rendering overhead.
While Volta (sm_70) has been dropped from recent pre-built binaries and required a manual 16-minute compilation in the previous benchmark, Ada Lovelace (sm_89) runs the official Windows CUDA 13.4 binaries out of the box.
Because the stock fan profile on this unit exhibited irregular behavior, all measurements were conducted with a custom background service modulating fan speeds dynamically against memory junction temperatures.
1. VRAM Integrity & Bandwidth: Full-Capacity Stress Test
The primary concern with any unofficial hardware modification is verifying whether all 32GB is physically sound. Poorly executed mods or modified VBIOS strings can misreport capacity, resulting in silent data corruption when writing to the upper address space. Because consumer GeForce GPUs lack ECC memory support, hardware memory faults do not trigger machine check exceptions and will silently corrupt data.
To verify hardware stability, I ran memtest_vulkan (v0.5.0) across the entire addressable space.
Standard 5-minute test of 1: Bus=0x01:00 DevId=0x2704   32GB NVIDIA GeForce RTX 4080
      1 iteration. Passed  0.0851 seconds  written:   25.4GB 637.5GB/sec        checked:   29.0GB 640.4GB/sec
    423 iteration. Passed 30.0324 seconds  written: 8957.4GB 639.4GB/sec        checked:10237.0GB 638.9GB/sec
   (snip)
   3247 iteration. Passed 30.0204 seconds  written: 8957.4GB 639.6GB/sec        checked:10237.0GB 639.2GB/sec
Standard 5-minute test PASSed! Just press Ctrl+C unless you plan long test run.
Under a 30,441 MiB allocation, the standard test (3,247 iterations) completed with zero errors, maintaining consistent read and write throughput of approximately 639 GB/s throughout.
Next, on-device copy bandwidth (D2D) and bidirectional host-to-device PCIe throughput were evaluated in PyTorch. To confirm that the expanded upper 16GB operates without latency penalties, measurements were repeated after pre-allocating and populating 24GiB of tensors in VRAM.
| Item | Empty | With 24GiB Allocated |
|---|---|---|
| On-GPU copy (D2D, read+write) | 601.0 GB/s | 599.9 GB/s |
| CPU→GPU (pinned) | 26.8 GB/s | 26.8 GB/s |
| GPU→CPU (pinned) | 26.3 GB/s | 26.3 GB/s |
| Matrix multiply fp16 16384×16384 | 105.70 TFLOPS | 105.45 TFLOPS |
Even with 24GiB allocated, on-device copy bandwidth shifted from 601.0 to 599.9 GB/s—well within run-to-run variance. Host-device transfer speed measured 26.8 GB/s over PCIe Gen4 x16 (against a theoretical ~31.5 GB/s), confirming normal link negotiation. The upper 16GB expansion operates at full native performance.
2. Quantization Scaling: Fitting Q8_0 and Generational Parity with V100
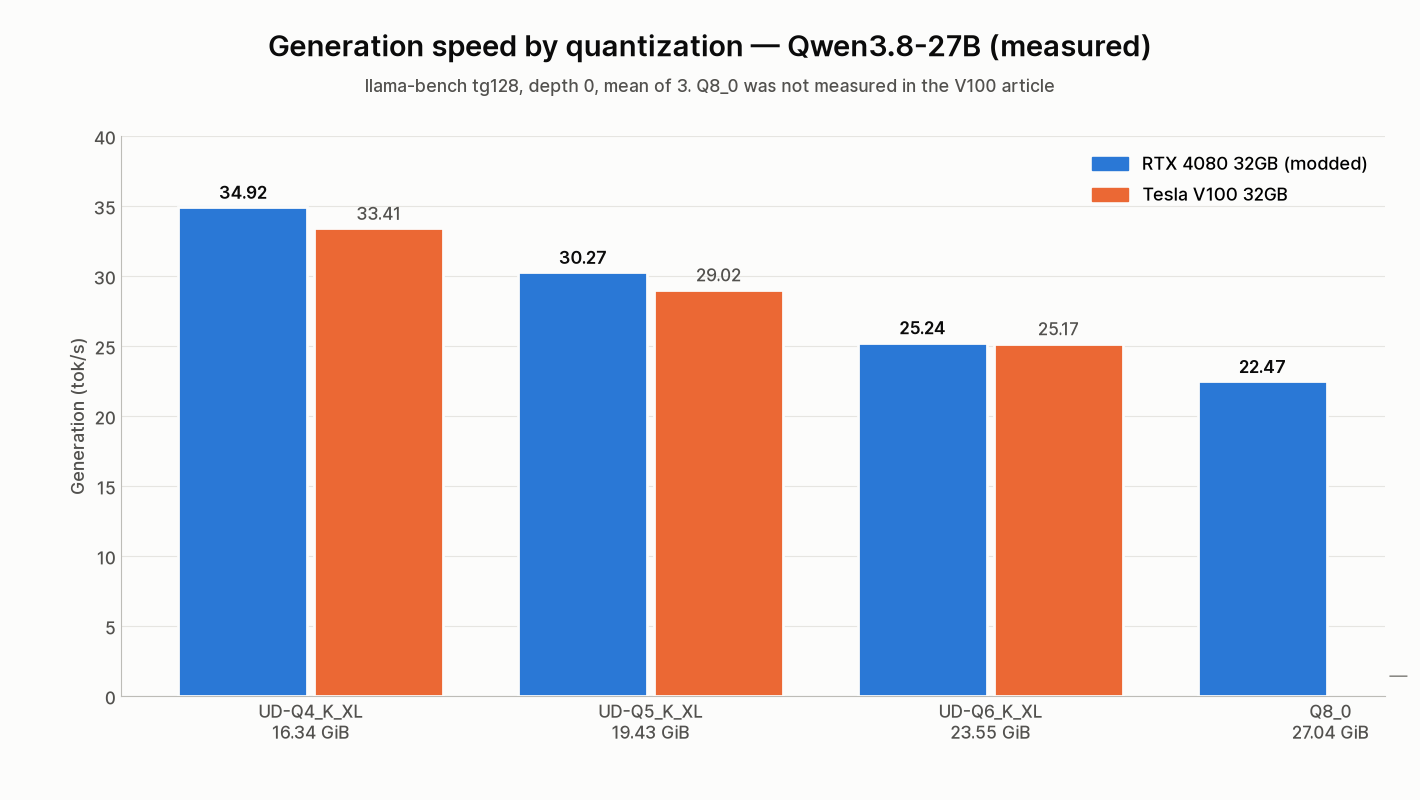
| Quant | Size | Prefill | Generation | Prefill @32K | Generation @32K | Peak VRAM | V100 Generation |
|---|---|---|---|---|---|---|---|
| UD-Q4_K_XL | 16.34 GiB | 1,933.24 | 34.92 | 1,440.64 | 31.35 | 18,760 MiB | 33.41 |
| UD-Q5_K_XL | 19.43 GiB | 1,811.88 | 30.27 | 1,377.92 | 27.56 | 21,610 MiB | 29.02 |
| UD-Q6_K_XL | 23.55 GiB | 1,824.73 | 25.24 | 1,377.87 | 23.33 | 25,826 MiB | 25.17 |
| Q8_0 | 27.04 GiB | 1,934.74 | 22.47 | 1,440.67 | 20.94 | 29,012 MiB | — |
(Units are tok/s. Peak VRAM represents the run up to depth 32,768. V100 figures are empirical measurements from the previous article.)
In token generation (decoding), UD-Q4_K_XL clocked 34.92 tok/s, representing a modest +4.5% gain over the V100’s 33.41 tok/s. Q5 was +4.3% faster, while Q6 yielded virtually identical numbers (25.24 vs 25.17 tok/s). Despite the V100 possessing higher raw memory bandwidth, modern Ada Lovelace architectural enhancements and optimized FlashAttention kernels offset the difference. The data makes one point unambiguous: this card is not an upgrade for users seeking higher token generation speeds.
In contrast, prompt processing (prefill) maintained 1,800–1,900 tok/s across all quantization levels, exceeding the V100 (826–882 tok/s) by more than a factor of two. This directly reflects generational compute gains.
The most notable milestone is that Q8_0 (27.04 GiB) fits entirely within VRAM, totaling 29,012 MiB at depth 32,768. This size is completely unachievable on a stock 16GB card and overflows a 24GB RTX 4090. Moving from Q4 to Q8 drops decode speed from 34.92 to 22.47 tok/s, yet 22 tok/s remains more than comfortable for interactive dialog.
(Note: In the separate context sweep below, Q4_K_XL at depth 0 measured 34.98 tok/s. This 0.06 tok/s variance is attributable to run-to-run process differences; comparisons within each section reference their respective tables.)
3. Context Scaling: Running Native 262,144 Tokens on a Single GPU
| Prompt Depth | KV Cache | Prefill (tok/s) | Generation (tok/s) | Peak VRAM | V100 Generation |
|---|---|---|---|---|---|
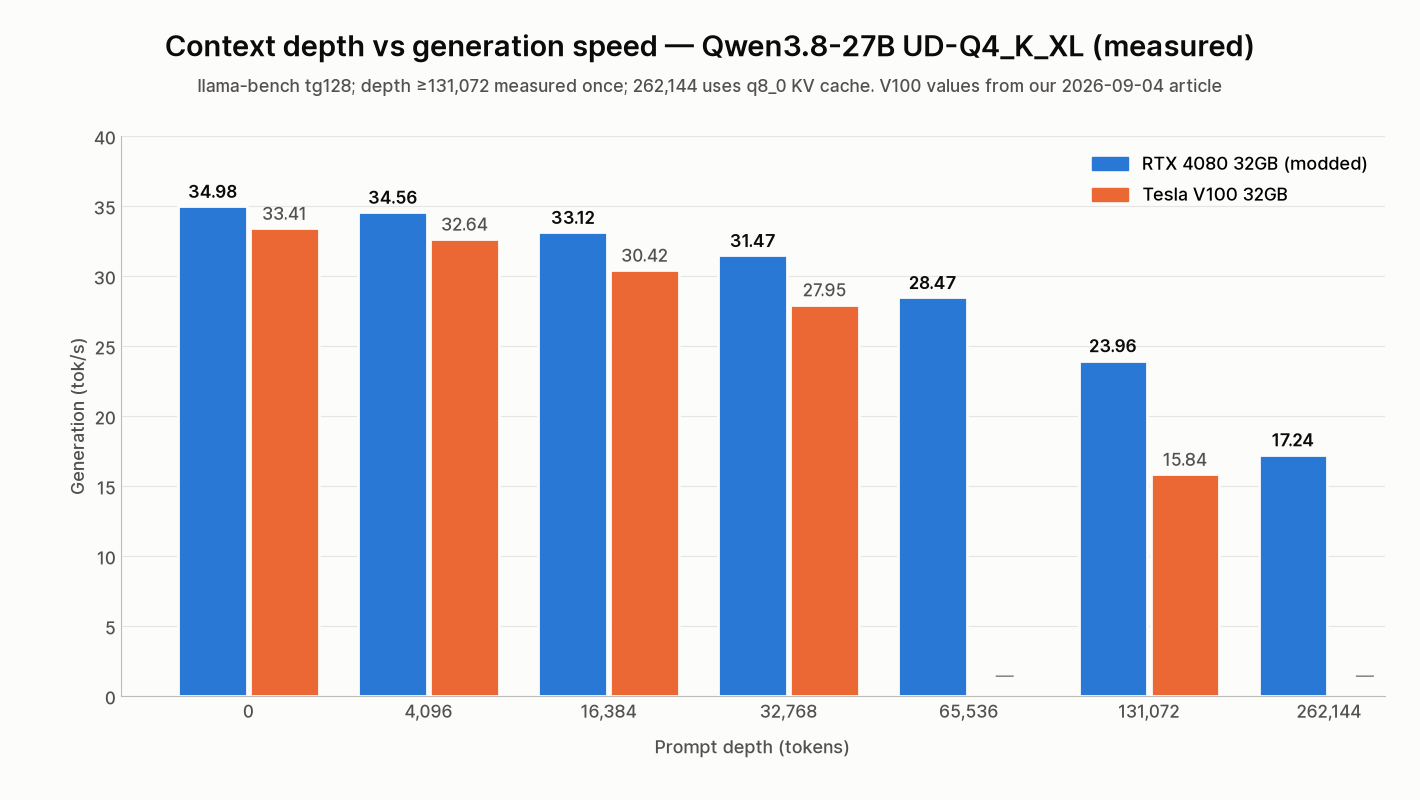
| 0 | f16 | 1,954.03 ± 42.23 | 34.98 ± 0.04 | 16,712 MiB | 33.41 |
| 4,096 | f16 | 1,855.82 ± 64.88 | 34.56 ± 0.08 | 16,952 MiB | 32.64 |
| 16,384 | f16 | 1,677.89 ± 42.49 | 33.12 ± 0.11 | 17,716 MiB | 30.42 |
| 32,768 | f16 | 1,428.27 ± 39.68 | 31.47 ± 0.09 | 18,760 MiB | 27.95 |
| 65,536 | f16 | 1,095.46 ± 14.42 | 28.47 ± 0.06 | 20,882 MiB | — |
| 131,072 | f16 | 767.51 | 23.96 | 24,996 MiB | 15.84 |
| 131,072 | q8_0 | 711.90 | 23.11 | 21,248 MiB | — |
| 262,144 | q8_0 | 434.03 | 17.24 | 26,240 MiB | — |
| 262,144 | f16 | Did not complete within 30 minutes (aborted) | 32,332 MiB (saturated) | — | |
At shallow context depths, performance remains within single-digit percentages of the V100. As context expands, the gap widens significantly. At 131,072 tokens, the V100 drops to 15.84 tok/s, whereas the RTX 4080 sustains 23.96 tok/s (~1.5x). Decode degradation from depth 0 is contained at -32% on Ada versus -53% on Volta. At extreme context depths, attention computation begins to rival raw bandwidth limitations, allowing Ada’s superior compute throughput to assert itself.
This leads directly into testing Qwen3.8’s native context limit: 262,144 tokens. While this demonstrated the true utility of 32GB VRAM, it also exposed a major operational pitfall.
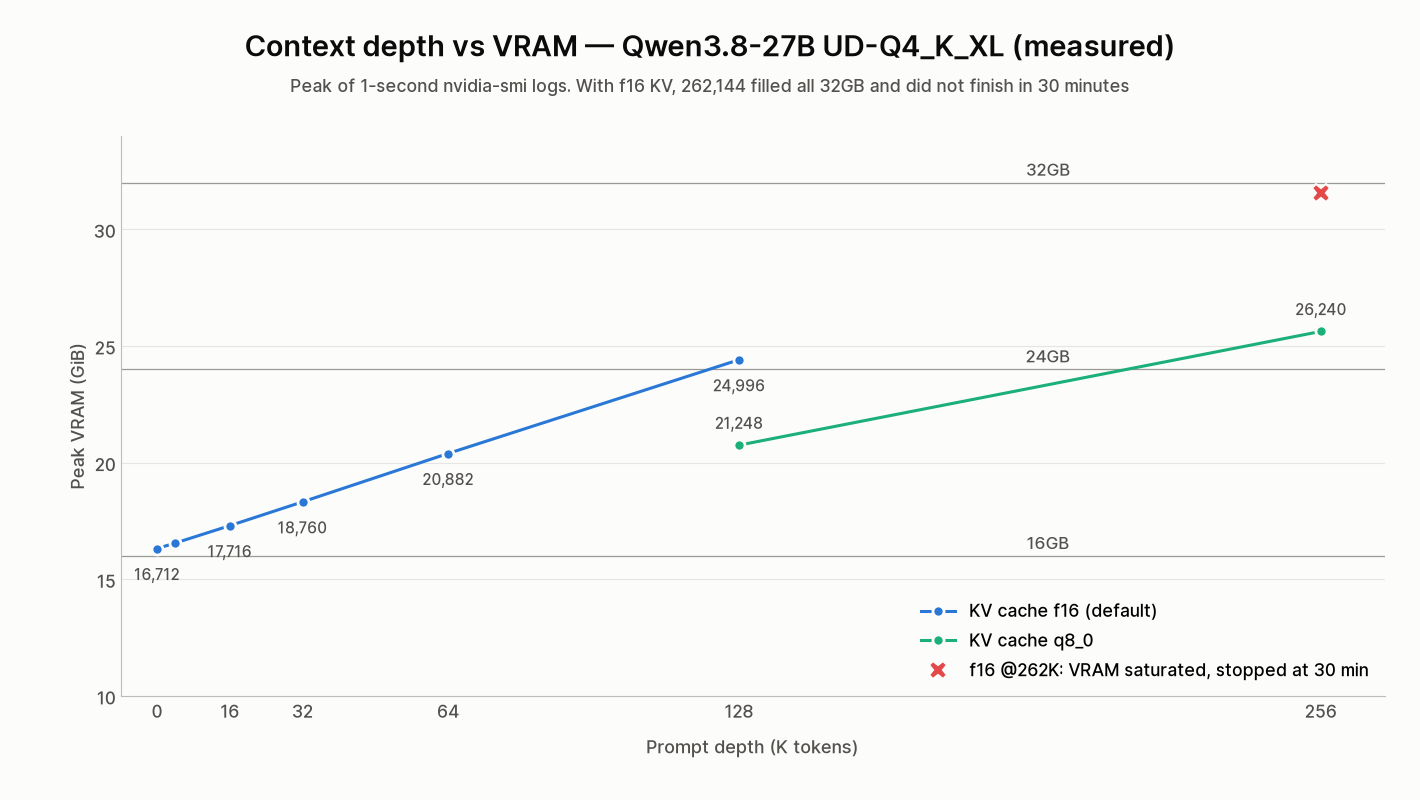
Default f16 KV Cache: Silent System-Memory Spillover
When launching a 262,144-token run with default f16 KV cache, VRAM pegged at 32,332 MiB and execution stalled indefinitely. While GPU utilization reported 100%, board power consumption collapsed from its typical 320W envelope down to an average of 118.9W.
Windows performance counters revealed that approximately 1.15GB had spilled into GPU shared system memory (RAM). The Windows NVIDIA driver defaults to allowing CUDA allocations to overflow into system RAM when VRAM is exhausted. Rather than terminating with an Out-of-Memory error, the runtime silently routes memory traffic across the PCIe bus, degrading throughput to an effective freeze. The run was aborted after 30 minutes of inactivity.
memory.used [MiB], utilization.gpu [%], power.draw [W]
32332 MiB, 100 %, 108.21 W    ← VRAM saturated, 100% utilization, power drops to one-third

InstanceName                        Shared Usage (bytes)
luid_0x00000000_0x00013206_phys_0   1154789376
By theoretical calculation, holding 262K tokens with an f16 KV cache slightly exceeds 32GB. Even an overflow as small as ~1GB renders the system practically unusable. A process that does not crash is not necessarily functioning properly; an unexpected drop in GPU power draw under heavy load is a primary indicator of VRAM spillover.
Quantized q8_0 KV Cache: Fitting in 26GB at 17.24 tok/s
Re-running with -ctk q8_0 -ctv q8_0 compressed the KV cache to 8-bit precision. Under these parameters, the full 262,144-token benchmark executed cleanly at a peak of 26,240 MiB, sustaining 17.24 tok/s and finishing in 6 minutes and 25 seconds. Compared to the indefinite stall on f16, the operational contrast is stark.
Measuring the computational penalty of q8_0 at 131,072 tokens showed generation dropping from 23.96 tok/s (f16) to 23.11 tok/s (q8_0), a modest -3.5% delta, while prefill decreased from 767.51 to 711.90 tok/s (-7.2%). In exchange, VRAM footprint was reduced by 3,748 MiB. While KV cache quantization on the V100 fell back to the CPU and was unusable, Ada Lovelace executes quantized KV kernels natively on the GPU. For long-context workflows, enabling q8_0 KV cache should be treated as mandatory.
Testing context limits with the Q8_0 model yielded depth 65,536 running at 31,114 MiB (19.63 tok/s) with f16 KV cache. With q8_0 KV cache, depth 131,072 succeeded at 31,500 MiB (16.84 tok/s). Running 128K context on a Q8_0 model is unique to 32GB cards, though with only ~1.2GB of headroom remaining, it borders on an experimental ceiling.
4. Prefill Throughput: Ingesting 100k Tokens in 85 Seconds
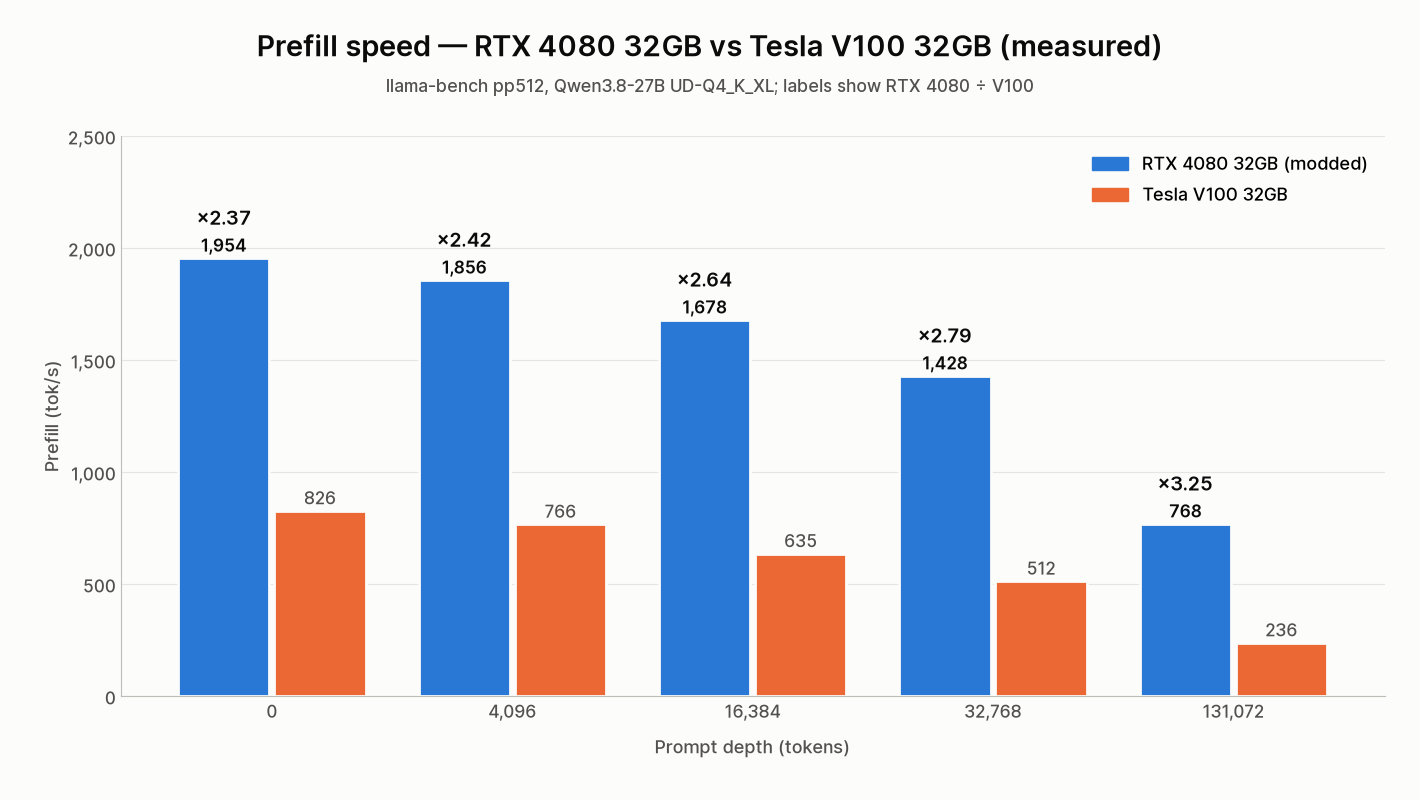
While generation speed remained neck and neck with the V100, prefill (prompt processing) displayed a substantial performance gulf: 2.37x at depth 0, 2.79x at 32,768, and 3.25x at 131,072 tokens.
Prefill throughput determines the time to first token (TTFT) when ingesting large contexts. When feeding entire documentation archives or codebases, prefill efficiency matters far more than token generation speed.
To evaluate real-world retrieval, I constructed an automated synthetic inspection log of warehouse equipment totaling approximately 129,000 Japanese characters (104,955 tokens). Buried deep inside was a single record detailing the serial number and next maintenance date for an auxiliary power unit in Warehouse 7, surrounded by numerous similar entries from other facilities.
Question: Give the serial number and the next inspection date of the backup power unit in Warehouse 7.
(prompt and answer were in Japanese)

- Serial number: RTX-KX-4080-32G
- Next inspection date: March 14, 2027| Item | Measured |
|---|---|
| Prompt Length | 104,955 tokens |
| Time to First Token | 84.8 s (prefill throughput 1,237.6 tok/s) |
| Generation Speed | 25.35 tok/s |
| Peak VRAM | 25,064 MiB (-c 131072) |
| Retrieval Accuracy | Both serial number and date correct |
The model ingested the 104,955 tokens in 84.8 seconds (effective prefill throughput of 1,237.6 tok/s) and retrieved both the serial number and inspection date flawlessly. On the V100, even at its baseline peak prefill speed (826 tok/s), reading this document would require over two minutes under ideal conditions, and substantially longer once context scaling degradation is factored in. For long-document processing, the modded RTX 4080 operates in a completely different tier from the V100.
5. Simulated 16GB vs. 24GB Limits: The Cost of Offloading
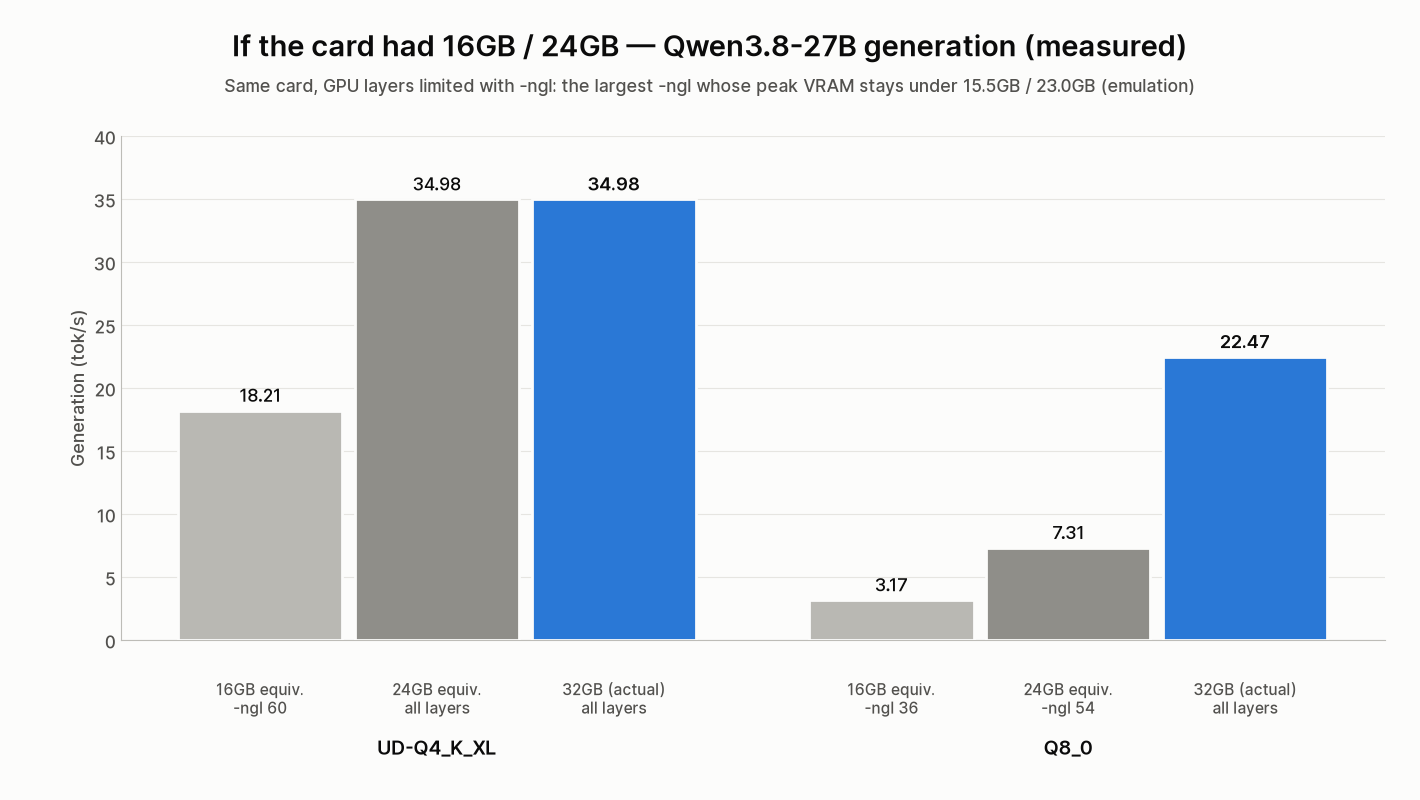
To demonstrate the concrete utility of 32GB, I evaluated performance under simulated 16GB and 24GB VRAM limits. Rather than using separate physical cards, GPU layer offloading was restricted via -ngl to the maximum layer count fitting under 15.5GB (16GB-class) and 23.0GB (24GB-class). Layers overflowing the GPU run on system RAM (DDR5-4800) via CPU compute. While physical 16GB and 24GB cards possess different core counts, this setup cleanly isolates the performance impact of memory capacity.
| Model | VRAM Limit | Layers on GPU | Peak VRAM | Prefill | Generation |
|---|---|---|---|---|---|
| UD-Q4_K_XL | 16GB-class | 60 / 65 | 15,428 MiB | 1,468.42 | 18.21 |
| 24GB-class | All | 16,712 MiB | 1,954.03 | 34.98 | |
| 32GB (physical) | All | 16,712 MiB | 1,954.03 | 34.98 | |
| Q8_0 | 16GB-class | 36 / 65 | 15,336 MiB | 500.63 | 3.17 |
| 24GB-class | 54 / 65 | 22,314 MiB | 896.26 | 7.31 | |
| 32GB (physical) | All | 29,012 MiB | 1,934.74 | 22.47 |
The results on Q8_0 are striking: against 22.47 tok/s when fully loaded in VRAM, speed collapses to 7.31 tok/s under 24GB constraints (~3x slower) and 3.17 tok/s under 16GB constraints (~7x slower). Offloading just 11 layers forces every token step to bottleneck on system RAM bandwidth.
Q4_K_XL fits completely in 24GB, showing no penalty. However, Q4 cannot fully fit within a 16GB boundary: offloading just 5 layers halves throughput from 34.98 to 18.21 tok/s. Running a 27B model on a 16GB card requires either accepting aggressive sub-Q4 quantization or absorbing this massive speed penalty.
To refine the opening premise: as long as a model fits entirely in VRAM, generation speed does not change; but the moment layers spill over into system memory, a 3x to 7x performance cliff emerges. The value of 32GB lies entirely in eliminating this cliff.
6. 125B Sparse MoE: Running Qwen3.8-Flash-Next Across RAM
Qwen3.8-Flash-Next is a preview of the upcoming Qwen4 architecture, featuring 125B total parameters with 6B active parameters per token. It also integrates a 51B n-gram embedding table and a 4B MTP head, routing across 512 total experts with 10 experts plus 1 shared expert activated per token (licensed under qwen-community-1.0).
The model was recognized natively by llama.cpp b10998 as architecture qwen4exp. Testing utilized Unsloth’s UD-Q2_K_XL quantization (3-part split, totaling 73.45 GiB). Because this exceeds 32GB VRAM, the weights were split across the GPU and 64GB of system RAM.
Examining the GGUF tensor layout reveals why this is feasible:
| Component | Size | Runtime Characteristics |
|---|---|---|
| Experts (48 layers) | 42.92 GiB | Sparse access: only a subset read per token |
n-gram embedding (per_layer_token_embd) | 26.82 GiB | Table lookup only (quantized to IQ4_NL) |
| Core layers (attention, norms) | ~3.7 GiB | Fully traversed on every token step |
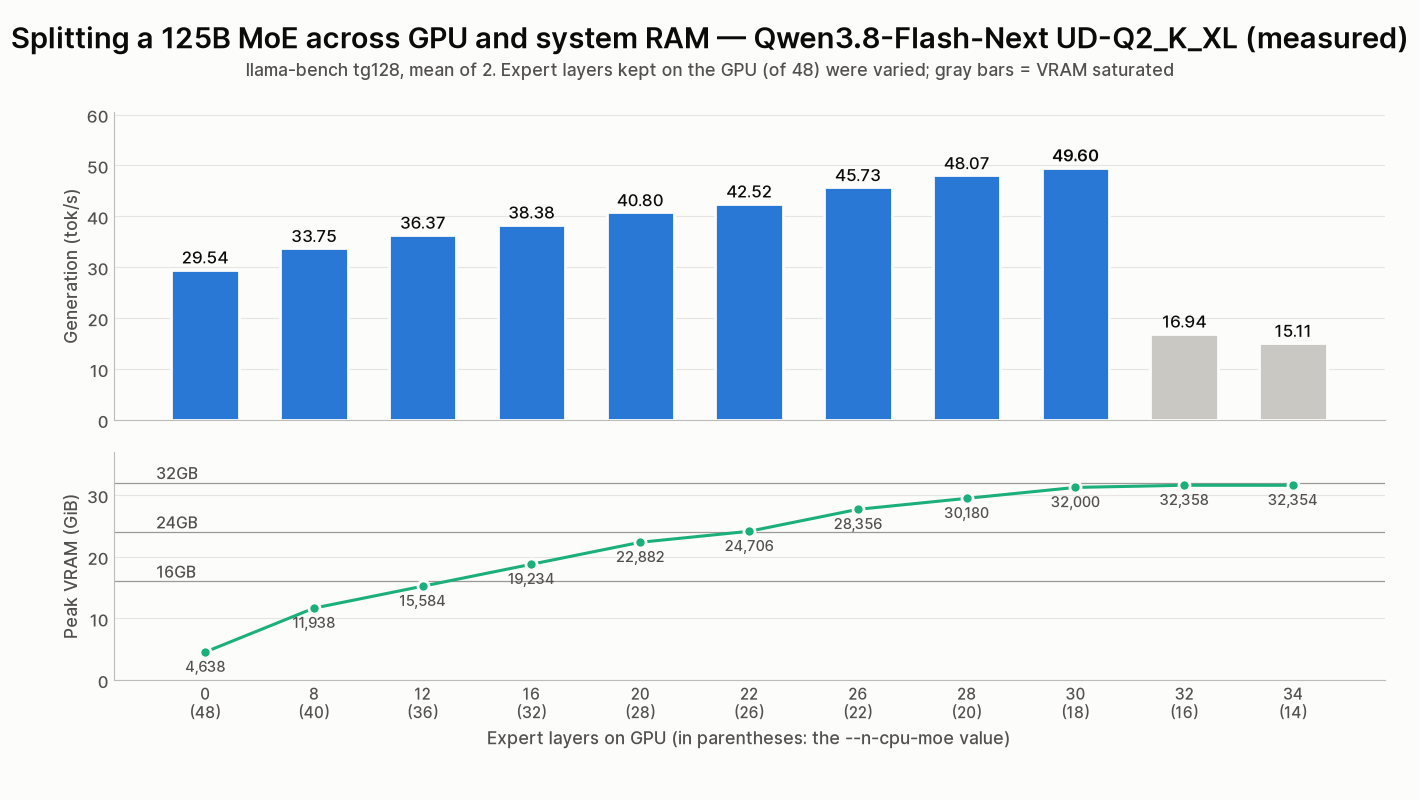
Core attention layers that execute every token account for only ~3.7 GiB, while the bulk of the model consists of expert weights (42.92 GiB) and table-lookup embeddings (26.82 GiB). By anchoring attention layers to the GPU, I varied the number of expert layers offloaded to the CPU via --n-cpu-moe to map performance scaling.
| Expert Layers on GPU | --n-cpu-moe | Prefill (tok/s) | Generation (tok/s) | Peak VRAM |
|---|---|---|---|---|
| 0 / 48 | 48 | 262.11 | 29.54 | 4,638 MiB |
| 8 / 48 | 40 | 301.28 | 33.75 | 11,938 MiB |
| 12 / 48 | 36 | 321.12 | 36.37 | 15,584 MiB |
| 16 / 48 | 32 | 340.12 | 38.38 | 19,234 MiB |
| 20 / 48 | 28 | 303.22 | 40.80 | 22,882 MiB |
| 22 / 48 | 26 | 387.95 | 42.52 | 24,706 MiB |
| 26 / 48 | 22 | 427.43 | 45.73 | 28,356 MiB |
| 28 / 48 | 20 | 436.58 | 48.07 | 30,180 MiB |
| 30 / 48 | 18 | 464.20 | 49.60 | 32,000 MiB |
| 32 / 48 | 16 | 101.10 | 16.94 | 32,358 MiB (saturated) |
| 34 / 48 | 14 | 75.81 | 15.11 | 32,354 MiB (saturated) |
Crucially, keeping all expert layers on the CPU (--n-cpu-moe 48) still achieved 29.54 tok/s—outperforming the dense 27B model at Q8_0 (22.47 tok/s). Because only 6B parameters activate per token, memory bandwidth pressure on system RAM remains manageable.
Progressively offloading more expert layers to the GPU produced linear performance scaling, reaching 49.60 tok/s at 30 GPU layers (--n-cpu-moe 18, utilizing 32,000 MiB of VRAM).
However, pushing two additional layers to the GPU (--n-cpu-moe 16) saturated VRAM at 32,358 MiB and cratered throughput to 16.94 tok/s due to the same system memory spillover observed in the 262K f16 test. Because spilling over is slower than keeping layers cleanly on the CPU, practical configurations should reserve safety margins for context, making --n-cpu-moe 20 an optimal baseline.
Interpolating 16GB and 24GB constraints from the data shows that a 16GB envelope caps at --n-cpu-moe 36 (36.37 tok/s) and a 24GB envelope at --n-cpu-moe 28 (40.80 tok/s). Compared to 49.60 tok/s on 32GB, this translates to ~0.73x on 16GB and ~0.82x on 24GB. Unlike dense models with their sharp performance cliffs, MoE architectures benefit from VRAM expansion in a smooth, gradual gradient.
Evaluation at 32K Context and Task Accuracy
At --n-cpu-moe 20 with 32,768 context depth, the model sustained 36.82 tok/s decode with 243.05 tok/s prefill over 4,096 tokens (peak VRAM: 31,374 MiB).
Interactive evaluation via llama-server (-c 32768, thinking disabled, temperature 0) verified task execution across reasoning, Python generation, and text synthesis (prompts provided in Japanese).
| Task | Result | Generation Speed |
|---|---|---|
| Math (apples and oranges word problem) | Correct (answer: 9, included verification step) | 40.71 tok/s |
| Python code (parse llama-bench JSON to Markdown) | Functional script matching spec; verified against benchmark logs | 43.73 tok/s |
| Text synthesis (pros/cons bullet list) | Logically valid, but omitted bullet format and led with cons | 42.41 tok/s |
(Excerpt from math response, translated)
Therefore, Taro bought 9 apples.
(Verification: 9 apples and 6 oranges = 120 * 9 + 80 * 6 = 1080 + 480 = 1560 yen, satisfying the condition.)

Answer: 9
While formatting adherence faltered on Japanese bullet points—a known characteristic of heavy 2-bit quantization, where Unsloth reports mean KL divergence of 0.2246 against BF16—the ability to run 125B-class inference locally at over 40 tok/s represents a remarkable capability. Model load time was 11.82 seconds, with system-wide RAM usage peaking at 54.59 GiB.
7. MiniMax H3 Video Generation: Where 32GB Yields No Speedup
MiniMax H3 is a 33B dense Diffusion Transformer (DiT) capable of generating synchronized video and 32kHz stereo audio (also known as Hailuo 3.0). Using ComfyUI’s official integration, testing utilized the Comfy-Org fp8 DiT (21.0GB) and int8 text encoder (27.1GB, based on Qwen3-VL-32B).
Workflows were executed via API using standard parameters: 1344×768 resolution, 124 frames (5.17 seconds at 24fps), and a 4-step turbo LoRA pipeline. To measure VRAM scaling, ComfyUI’s --reserve-vram flag was used to simulate 24GB (8GB reserved) and 16GB (16GB reserved) environments.

A steam locomotive crosses a snowy mountain bridge at dawn, the camera tracks alongside
the train as steam billows into the cold air. Audio: rhythmic chugging engine, a long whistle, wind.
The prompt yielded a locomotive crossing a mountain bridge, accompanied by synchronized steam whistle and engine audio effects, showing strong generation coherence from a 4-step turbo pipeline.
Now to the performance metrics across simulated memory tiers:
| VRAM Configuration | Launch Flag | Generation Time (Seed 1 / 2) | Sampling per Step | Peak VRAM |
|---|---|---|---|---|
| 32GB (Native) | — | 156.1 s / 150.1 s | 31.2 s | 31,616 MiB |
| 24GB-class | --reserve-vram 8 | 156.4 s / 150.2 s | 31.2 s | 26,720 MiB |
| 16GB-class | --reserve-vram 16 | 156.1 s / 150.2 s | 31.6–31.8 s | 18,432 MiB |
(Generation time encompasses the full pipeline from queuing to file output, including text encoding, DiT sampling, and VAE decode.)
Performance was virtually identical across all configurations. Even when constrained to a 16GB budget, per-step sampling time increased by only ~1% (31.2s vs 31.6–31.8s). ComfyUI 0.33 uses dynamic VRAM loading to stream weights across PCIe Gen4 as required. Streaming 21GB of weights over PCIe (measured at 26.8 GB/s) takes under one second, whereas calculating attention over 124 frames consumes ~31 seconds per step. Consequently, the workload is entirely compute-bound, not VRAM-capacity-bound.
Unlike LLM inference where capacity differences cause massive speed variations, 32GB VRAM does not make MiniMax H3 turbo generation faster. Optimizing generation times requires tuning sampling steps or resolution, not VRAM capacity.
System memory consumption, however, is substantial: system-wide RAM peaked at 58–60GB across all runs. With the text encoder requiring 27GB on its own, 64GB of system RAM represents the absolute minimum requirement.
A 20-step quality run without turbo yielded 648.5 seconds (~10 min 49 s) for the second generation, with per-step sampling holding steady at 31.2 seconds. Because generation time scales linearly with step count, using turbo for iteration and 20 steps for final renders is the recommended approach.
8. Power and Thermal Profile: 20 Minutes of Sustained Load
In a clamshell memory design, thermal dissipation on the rear PCB packages is a primary reliability concern. To test stability, ten consecutive ~3,000-token generation passes were executed under Q8_0 (~29GB VRAM allocation) over 20 continuous minutes while logging sensor data at 1-second intervals.
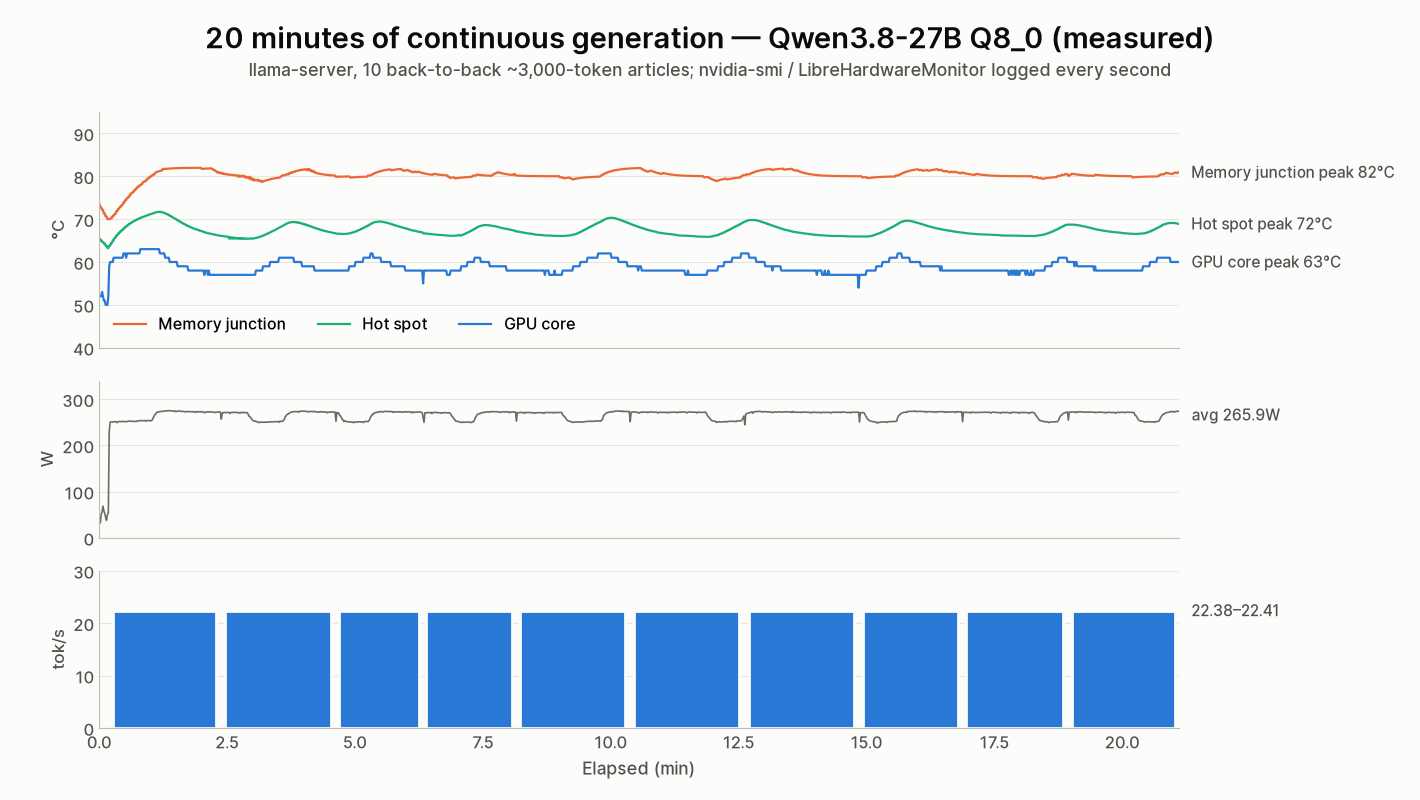
| Metric | Max | Average |
|---|---|---|
| GPU core temperature | 63°C | 58.9°C |
| Hot spot temperature | 71.7°C | 67.5°C |
| Memory junction temperature | 82.0°C | 80.2°C |
| Power draw (generating) | 275.4W | 265.9W |
| Generation speed (10 runs) | 22.38–22.41 tok/s (28,092 tokens total) | |
| SM clock (under load) | 2,775–2,790 MHz | |
Token generation remained rock-solid between 22.38 and 22.41 tok/s across all ten runs. Driver performance counters confirmed zero microseconds of hardware or software thermal slowdown. While power was capped at the board’s 320W limit during bursts, thermal throttling never occurred.
> nvidia-smi -q -d PERFORMANCE
    Clocks Event Reasons Counters
        SW Power Capping                  : 170115776 us
        Sync Boost                        : 0 us
        SW Thermal Slowdown               : 0 us
        HW Thermal Slowdown               : 0 us
        HW Power Braking                  : 0 us
A defining characteristic of this board is the thermal gradient: while the GPU core remains cool at ~60°C, memory junction temperature hovers around 80°C. While GDDR6X operates within safe tolerances at this level, monitoring core temperatures alone will mask high memory heat. Maintaining these temperatures required fan speeds fluctuating between 30% and 93%, meaning acoustic output is significant.
Average power consumption over the 20-minute test measured 265.9W. Sustained prefill and 262K context workloads pinned the board at its 320W ceiling, recording an instantaneous peak of 321.08W. This is roughly 50W higher than the Tesla V100 (269.2W peak), necessitating adequate power supply headroom.
9. Modded-Card Nuances and Practical Considerations
16GB BAR1 Aperture and Model Load Modes
As noted earlier, BAR1 remains fixed at 16,384 MiB despite total VRAM reaching 32GB. To evaluate whether this affects loading efficiency, I tested llama.cpp’s --load-mode options across three runs with files pre-cached in OS RAM.
| Model | mmap (Default) | none | dio (DirectIO) |
|---|---|---|---|
| UD-Q4_K_XL (16.34 GiB) | 6.04 / 5.98 / 6.00 s | 2.77 / 2.85 / 2.78 s | 2.84 / 3.00 / 2.87 s |
| Q8_0 (27.04 GiB) | 9.49 / 9.32 / 9.24 s | 4.06 / 4.01 / 4.09 s | 4.13 / 4.05 / 4.13 s |
Direct loading via none completed in less than half the time of default mmap. Because mmap involves page fault overhead even on factory hardware, this difference cannot be definitively attributed to the 16GB BAR1 limit. Nevertheless, when loading entire models into VRAM, specifying --load-mode none is recommended. Note that legacy --no-mmap has been removed in b10998 and triggers an argument error.
error: invalid argument: --no-mmapSilent Performance Degradation on VRAM Exhaustion
The Windows NVIDIA driver automatically routes excess VRAM allocations to system RAM. While 32GB invites running larger models, configurations leaving under 1GB of VRAM headroom should be avoided. Users preferring hard OOM crashes over extreme slowdowns can configure “CUDA – Sysmem Fallback Policy” in the NVIDIA Control Panel.
Fan Acoustics and Control
Equipped with a single-fan blower-style assembly, default fan profiles fail to respond adequately to memory junction heat. Even with custom software control, heavy loads push fan speeds past 90%, making the card unsuitable for quiet desktop environments.
Standard Driver Compatibility
Despite being a modified card, official NVIDIA driver 616.56 recognized the full 32GB without issue. llama.cpp (CUDA 13.4), PyTorch (cu130), and Vulkan-based test suites functioned without requiring custom patches or modified INF files.
10. Comparison with Tesla V100 32GB: Generational Distinctions
| Metric (Qwen3.8-27B UD-Q4_K_XL) | Modded RTX 4080 32GB | Tesla V100 32GB |
|---|---|---|
| Generation (depth 0) | 34.98 tok/s | 33.41 tok/s |
| Generation (depth 131,072) | 23.96 tok/s | 15.84 tok/s |
| Prefill (depth 0) | 1,954.03 tok/s | 826.03 tok/s |
| Prefill (depth 131,072) | 767.51 tok/s | 236.50 tok/s |
| Peak VRAM (depth 131,072) | 24,996 MiB | 25,264 MiB |
| KV cache q8_0 | Accelerated on GPU | CPU fallback (effectively stalls) |
| 262,144 tokens | 17.24 tok/s with KV q8_0 | Not measured |
| Peak power | 321.08 W | 269.2 W |
| llama.cpp support | Official releases work out of the box | Requires custom sm_70 build |
| Display output | Yes | No |
| Warranty | None (hardware mod) | None (used enterprise surplus) |
For short interactive prompts, generation speed is nearly identical, making the V100 a viable low-cost option. The critical advantages of the RTX 4080 emerge in prefill throughput on massive prompts and native execution of modern features like KV cache quantization. Features that fall back to CPU on Volta run fully accelerated on Ada Lovelace.
Pricing reports from Chinese secondary markets place these modded units at around 10,000 RMB (~$1,480 USD). While pricier than a surplus V100 32GB, it sits below the RTX 5090’s $1,999 USD MSRP. Whether that premium is justified depends on how heavily your workload relies on prefill speed and native kernel compatibility.
Target Audience & Caveats
Recommended For
- Users running 27B–32B models at high quantization (Q6–Q8) entirely within VRAM (where 24GB cards suffer a ~3x slowdown on Q8_0)
- Workloads requiring 100k+ token document or codebase ingestion (where prefill is 2.4–3.2x faster and 262K context fits on a single card)
- Users looking to run 100B-class sparse MoE models locally via system RAM offloading
Key Caveats
- Identical generation speed to stock 16GB cards: If your models already fit in 16GB, token generation speed will not improve.
- No speedup in video generation (MiniMax H3 turbo): Compute bottlenecks mean restricting VRAM to 16GB showed no performance loss.
- No manufacturer warranty and high fan noise: Clamshell thermal loads require aggressive fan profiles.
- Silent overflow behavior: Running out of VRAM causes severe slowdowns rather than explicit crashes.
- High system RAM requirements: 100B MoE and video workflows push 64GB of system RAM to its practical ceiling.
Summary
The modded RTX 4080 32GB is not an accelerator for existing 16GB workloads, but an enabler for models and context windows that previously could not fit.
- Token generation on Q4_K_XL measures 34.98 tok/s, matching the Tesla V100 32GB (33.41 tok/s) as predicted by identical memory bandwidth.
- Q8_0 (27.04 GiB) fits completely in VRAM at 22.47 tok/s, establishing clear superiority over 24GB (7.31 tok/s) and 16GB (3.17 tok/s) limits.
- 262,144 tokens execute cleanly in 26,240 MiB with q8_0 KV cache at 17.24 tok/s, while unquantized f16 overflows and stalls indefinitely.
- Prefill throughput is 2.37–3.25x faster than the V100, ingesting 104,955 tokens in 84.8 seconds to answer correctly.
- The 125B Qwen3.8-Flash-Next MoE reaches up to 49.60 tok/s split across system RAM, before collapsing to 16.94 tok/s when over-allocated.
- MiniMax H3 video generation runs in ~150 seconds, with zero performance penalty when restricted to 16GB.
- VRAM stress testing completed with 0 errors, sustaining ~600 GB/s bandwidth with 24GiB allocated, and zero thermal throttling over 20 minutes of continuous load.
If your current workflow is constrained by just a few gigabytes on a 16GB card, this mod provides a targeted solution. Conversely, if your models already reside comfortably within 16GB, you are paying a premium for identical generation throughput. The value of 32GB is realized the exact moment a workload crosses that capacity threshold, turning a 3x to 7x offloading penalty into native GPU performance.
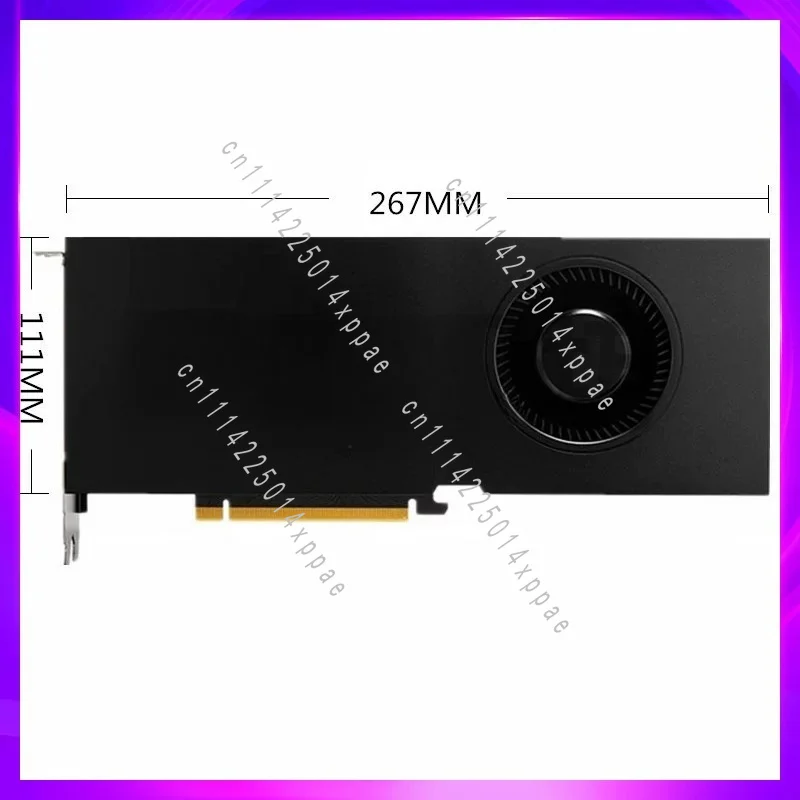
RTX4080 Super 32G Graphics Card (RTX4090 48G / 3090 24G / 3080 20G also available)
Related
- Tesla V100 32GB Runs Qwen3.8-27B: 131k Context on a Single Card — Measured Benchmark
- Tesla V100 32GB in 2026: Local LLM Benchmark with Qwen 3.6
- Qwen 3.6 on a Mac, Measured
Reproduction Notes
Every number above comes from the output of these commands. All measurements were taken on September 16, 2026, on the same machine with the same build.
# llama.cpp (just unzip the official build)
llama-b10998-bin-win-cuda-13.4-x64.zip + cudart-llama-bin-win-cuda-13.4-x64.zip

# Models
hf download unsloth/Qwen3.8-27B-GGUF Qwen3.8-27B-UD-Q4_K_XL.gguf Qwen3.8-27B-UD-Q5_K_XL.gguf ^
  Qwen3.8-27B-UD-Q6_K_XL.gguf Qwen3.8-27B-Q8_0.gguf --local-dir models
hf download unsloth/Qwen3.8-Flash-Next-GGUF --include "UD-Q2_K_XL/*" --local-dir models\flashnext

# Quantization sweep
llama-bench -m models\Qwen3.8-27B-<quant>.gguf -ngl 99 -p 512 -n 128 -d 0,32768 -r 3

# Depth sweep (one process per depth; -r 1 at 131,072 and above)
llama-bench -m models\Qwen3.8-27B-UD-Q4_K_XL.gguf -ngl 99 -p 512 -n 128 -d 65536 -r 3
llama-bench -m models\Qwen3.8-27B-UD-Q4_K_XL.gguf -ngl 99 -p 512 -n 128 -d 262144 -r 1 -ctk q8_0 -ctv q8_0

# 16GB / 24GB emulation (limit -ngl)
llama-bench -m models\Qwen3.8-27B-Q8_0.gguf -ngl 54 -p 512 -n 128 -r 2

# Qwen3.8-Flash-Next (some experts on the CPU)
llama-bench -m models\flashnext\UD-Q2_K_XL\Qwen3.8-Flash-Next-UD-Q2_K_XL-00001-of-00003.gguf ^
  -ngl 99 --n-cpu-moe 20 -p 512 -n 128 -r 2

# Load time
llama-server -m models\Qwen3.8-27B-Q8_0.gguf -ngl 99 -c 4096 --load-mode none

# MiniMax H3 (with ComfyUI 0.33.0 running, the template's graph submitted via the API)
python main.py --fast fp16_accumulation fp8_matrix_mult [--reserve-vram 8 | 16]

# VRAM, power, temperature (1-second log)
nvidia-smi --query-gpu=memory.used,utilization.gpu,power.draw,temperature.gpu,clocks.sm,clocks.mem,pcie.link.gen.gpucurrent --format=csv,noheader,nounits -l 1
llama-bench used 3 runs (1 run at depth 131,072 and above and for Q8_0 at deep depths; 2 runs for the -ngl and --n-cpu-moe sweeps). VRAM, power and temperature are peaks from a 1-second log; memory junction temperature is from LibreHardwareMonitor’s sensor.
See you next time.




Leave a Reply